
ARR Multiples: 10 SaaS Verticals Compared [2022]

There’s a lot of confusion on how to value SaaS companies, and especially ARR multiples. Whilst we won’t discuss here how to value yours (check out our tutorial on SaaS valuation), in this article we are looking at the ARR multiples of 12 different SaaS verticals to identify patterns you can use for your own valuation.
This article is based on the thorough analysis of 120 publicly-listed comparables which we are listing below. For our calculations, we are using the latest financial quarters and market cap at date of writing this article (Q2 2022).
120 SaaS Companies ARR Multiples
First, we’ve listed below all 120 companies by ARR multiple. These companies are all publicly-listed SaaS: Enterprise, Software and Cloud SaaS companies. The ARR multiples range anywhere from 0.5x to 55x.
Median: 11.6x
Average: 9.7x

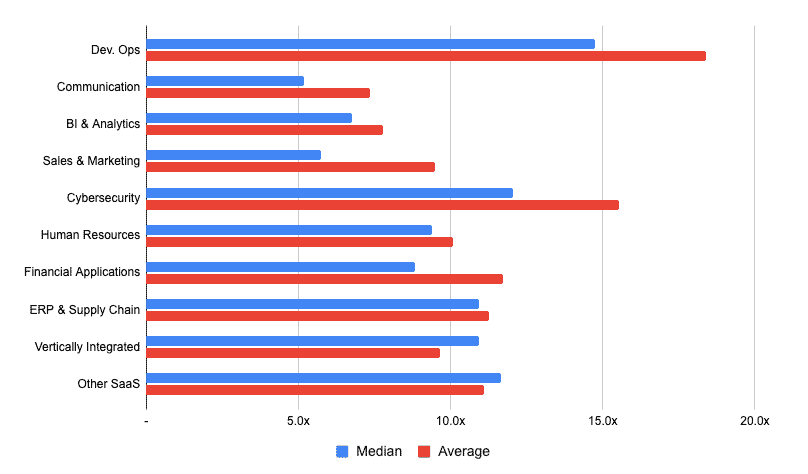
10 SaaS Verticals Compared
Now, let’s look at the same 120 companies but broken down by industry vertical, we obtain the following:
This is how it looks like when we also compare LTM Revenue growth and Gross margin:
| Vertical | Count | Average | Median | LTM Revenue growth | Gross Margin |
|---|
First, whilst most of verticals are relatively similar, we notice some clear differences also. For example, companies in verticals like Dev Ops and Cybersecurity tend to have higher ARR multiples vs. other industries.
Why is that?
The differences between the different verticals (and by extension between all SaaS companies) can be explained by 3 main factors:
- Growth
- Profitability
- ARR: B2B companies with high ARR tend to have higher multiples because of lower churn and higher barriers to entry
As you know, when we look at SaaS companies we often look at their Rule of 40 metric: a combination of revenue growth and profitability (either EBITDA margin or FCF margin).
So, adding the median ARR into the mix, this is what we obtain:
| Vertical | Count | Average | Median | LTM Revenue growth | Rule of 40 | ARR (median) |
|---|
Although verticals with high ARR multiples have indeed better metrics vs. others (for example Cybersecurity and Dev. Ops fare well vs. the average), this isn’t an exact science either.
For example, industries like Fintech with strong metrics (56% Rule of 40 and $796k median ARR) don’t necessarily have the high multiples they should have as per our analysis (~9x median ARR multiple).
Should You Use Industry Average ARR Multiples?
ARR multiples should be looked at company level and not necessarily verticals which have their limitations as we just saw.
Whilst we can infer some general rules when looking at different SaaS verticals (e.g. one sector is growing faster or tend to have higher margins), finding the right ARR multiple can’t just be limited to using the vertical’s median value.
Instead, looking at the industry vertical help us steer valuation up or down, yet should always be looked at at the company level instead.
In other words, if a Sales & Marketing Series A startup is valued at 20x ARR based on its latest funding round, it would be safe to assume a Cybersecurity Series A startup in comparison to have a higher multiple, all things being equal.
By all things being equal we mean the 3 factors driving valuation shall be the same, meaning: growth (revenue growth), profitability (Rule of 40) and ARR.


Enterprise SaaS financial model
Download an expert-built 5-year Excel financial model for your pitch deck
Enterprise SaaS financial model
Download an expert-built 5-year Excel financial model for your pitch deck