
Bottom-up vs. Top-down Sales Forecasting

If you are building a financial plan for your business, you might have heard of the bottom-up and top-down approaches. But what exactly is it? How are they different? Which one should you use?
Although very different, each has their pros and cons. In short, both methods should be used together to create accurate sales forecasts.
Although you should be building bottom-up sales forecasts from your business’ own metrics (customers, products, prices), a top-down method allows you to double-check whether your sales forecasts make sense by using market size and percentage of market share.
Forecast sales with a bottom-up approach
Bottom-up: what is it?
You might have heard of bottom-up and top-down approach when calculating market size for instance. If you haven’t yet, see here an article where we discuss the 2 approaches when estimating the market size for your business, and how does it ties into your revenue projections.
When estimating your revenues, bottom-up is undeniably the most accurate method. A bottom-up approach starts from the products and / or services you sell, and apply expected conversions to calculate revenues. In short:
Revenues = Price x Conversions
Identify your sales funnel to forecast conversions
Because we start from the “bottom” i.e. sales volume (customers) and prices, we need to clearly identify the sales funnel.
Whether you have a retail or digital business, your customers will convert through a sales and/or marketing funnel. Leads become customers by going through different steps. Whilst some businesses have very detailed sales and marketing funnels (think ecommerce for instance), others are more straightforward (e.g. retail).
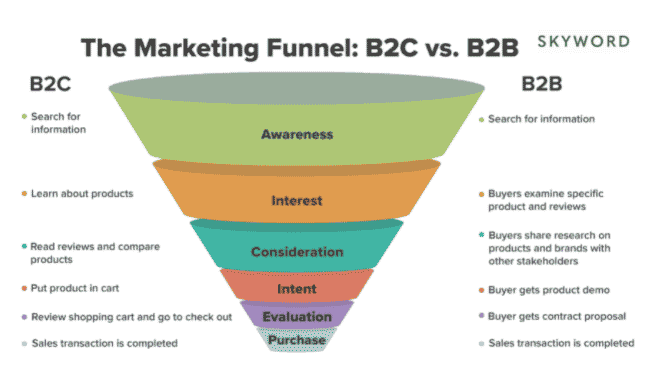
When building your projections, you should ask yourself: what are the different steps the average customer goes through? Let’s see an example with a software company:
Software businesses typically combine a paid marketing (paid ads for instance) strategy to acquire visitors on their website (leads) as well as sales people later on to convert these leads into customers. The first step is a marketing funnel, and the second sales funnel. Here customers are a function of a visitor traffic (on a website), a conversion rate (a signup for example – visitors become “leads”) and another conversion rate (from Sales Reps – leads becomes “customers”).
In this example, we could then have:
- 1,000 visitors x 5% signup rate = 50 leads
- 50 leads x 30% conversion rate (from Sales Reps) = 15 conversions
Finally, assuming a conversion is worth $100:
Revenues = 15 conversions x $100 = $1,500
How to forecasts revenue with a bottom-up method?
Whilst pricing is an input from you, sales volume is driven by internal factors such as:
- Advertising budget (paid ads, content, etc): especially true for B2C businesses
- Sales force (sales people): usually for B2B businesses only
For instance, assuming you are running an online shop and:
- You spend $100k p.a. in advertising
- Average cost-per-click of your marketing campaigns is $2.0
- Your average conversion rate is 1.5%
- Your average order value is $350
Therefore your expected revenues for the year are:
Revenues = $100k / $2 x 1.5% x $350 = $262,500
Let’s use another example: a B2B SaaS business. Let’s assume:
- You hired 3 sales people
- sales people are fully operational and close in average 5 accounts per month
- Your average subscription is priced at $5,000 p.a.
Expected revenues for the year are:
Revenues = 3 x 5 x 12 x $5,000 = $900,000
Why bottom-up is the best method to create sales forecasts
Bottom-up is appreciated amongst investors and venture capitalists as it uses real, verified data points from your business (e.g. pricing, volumes) which can be compared to historical performance (if any). For instance, if you expect to close 100 accounts a year with 5 sales people but only closed 20 with 2 sales people last year, you might be overestimating revenues.
Also, bottom-up has the advantage of being useful for you to drive the business when used in your budget. Indeed, your budget is based on operational metrics which you can track. Also, you can fully understand the drivers that increase or put pressure on your financials. That way, you will better, informed decisions. A bottom-up budget will, among others, allow you to answer questions such as:
- What is the breakeven (the number of sales / accounts / users you need to turn a profit)
- How much should you price your product
- How many employees should you hire (e.g. sales people)
- How much should you budget in marketing to realise revenues
- How much can you pay employees (including commissions and bonuses)
Double-check revenues using a top-down approach
Step 1. Estimate the size of your SOM
SOM is your Serviceable Obtainable Market. In short, it is the size of the market you can realistically reach. For more information on the definition, see our article on how to estimate TAM, SAM and SOM for your business.
Let’s assume we are a marketplace business selling healthcare supplies to residential care businesses in the UK. We know from public sources the worldwide healthcare supplies market is estimated at ~$80bn (that’s our TAM). Looking at SAM, we estimate from these public sources and GDP figures the UK B2B healthcare supplies to be 8% of the global market, our SAM therefore is ~$7bn. Now, from our research we know UK Residential care spend as a percentage of total UK healthcare spend is 30%, therefore we estimate SOM to be ~$2bn.
Step 2. Assume a target market share
Once you have obtained an estimated market size (SOM) for your business, you will need to make assumptions in terms of market share. This is a percentage of the total SOM you expect to aim to capture within the next 3 – 5 years (depending on the time scale you are forecasting).
Whilst this market share percentage is an assumption from you, it needs to be realistic. Indeed, you will need to take into consideration factors such as:
- Fragmentation of competitive landscape. Typically, the less fragmented your market is the more challenging it will be to penetrate it.
- Existing products. Is your product 10x better vs. competition or more or less a copy cat? It is safe to assume that the better your product is over your competitors’, the easier it will be to capture market share
- Switching costs. Are you competitors practicing long-term contract with expensive breaking fees? If so, it might more difficult than you think to acquire their clients as they would need to pay a cost (not just monetary but also effort-based, time-based or psychological) to do so. See a definition of switching costs by Investopedia
Step 3. Calculate expected revenues
Using our estimated market size and market share assumptions, calculate your revenues projections using the following formula:
Revenues = SOM x Market share
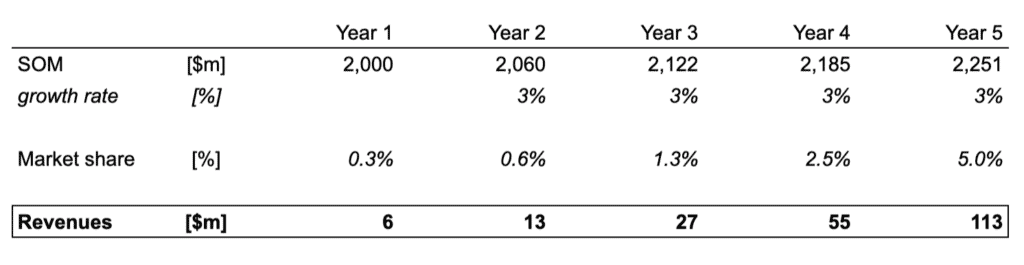
Let’s use our marketplace example again:
- We are forecasting 5 years
- Our business will not change this period (therefore, our SOM will remain the same too)
- SOM is increasing at 3% annually
- We have no operations yet
- We plan to capture 5% of the market by year 5
- Therefore expected revenues are $113m by year 5
Putting it all together
We have seen revenues can be either calculated using a bottom-up or a top-down approach. Yet, if you should choose one, you should use bottom-up as it uses real data from your businesses, as such is the most accurate method, and also helps you drive the business when making decisions.
Ideally, you would want to calculate revenues projections using bottom-up, and double check what it actually means in terms of market share by estimating SOM using a top-down approach.
Let’s see an example of how the 2 approaches are used together. Let’s assume you plan to launch a niche B2B ecommerce business and estimate $100m revenues by year 3 (bottom-up). Your assumptions are:
- $2,000,000 paid marketing
- $1.0 cost-per-click
- 2% conversion rate
- $2,500 average order value
Revenues = $100m = $2m / $1 x 2% x $2,500 = $100m
Let’s look a top-down approach instead. $2,000,000 in paid ads and $1.0 CPC means that there are at least 2,000,000 clicks on your ads per year. Assuming 10% click-through-rate, this means there are at least 20 million impressions per year for your keywords. The problem is, by looking at search term reports (e.g. Google Trends), you realise these keywords only trigger approximately 5 million impressions per year… You are likely overestimating your revenue projections as you originally did not take into account market size (SOM) in your projections.
For more information on startup revenues projections and financial modelling, see our articles below: