
SaaS Valuation: The VC Proven Method To (Accurately) Value SaaS
A lot has already been written on startup valuation, and SaaS valuation in particular. Yet, what most articles online seem to be missing is a clear methodology that allows anyone to estimate an accurate valuation for their SaaS, Enterprise or Software company.
We already wrote about valuation for other tech verticals, yet it took us almost 6 months to write this guide as we dug through over 1,000 data points, financial metrics and valuation multiples of 120+ publicly listed SaaS companies.
We didn’t invent anything either. All major VC firms and investors uses this very same methodology, for SaaS but also any industry beyond tech. Indeed, investors typically use different methodologies to come up to a valuation range they can use as a solid ground for negotiation. The one we discuss here is the most accurate we found so far.
Don’t get us wrong: this isn’t for any SaaS. Instead, this methodology is only valid for startups that already have some historical performance and a resilient growth profile (more on this below). Also, it goes without saying that pre-revenues startups aren’t suitable either (for more information on how to value pre-revenue startups, read our article here).
So if your your SaaS business falls into these criteria, this article is for you. Follow along, and you’ll be able to estimate your own SaaS business valuation with a proven and rock-solid methodology using publicly-available and verified assumptions investors use every day, and anyone can look into.
Disclaimer: Is This Article For You?
As we already discussed here, not all startups can use the same valuation methodology. Indeed, an early-stage startup will rely heavily on the VC method (discounting VC’s expected future return on capital) as it lacks metrics. Instead, Series A+ startups typically have more metrics they can benchmark against comparable companies to estimate their own valuation.
In other words, the more early stage a business is, the more hazardous it is to estimate its valuation.
So, in this article, we discuss a powerful methodology that allows anyone to calculate an accurate valuation for any SaaS business, assuming it meets all the following 2 basic criteria:
- 3 years minimum of financial performance: at the very least, revenues
- Less than 100% year-on-year revenue growth: early-stage SaaS with, for example, +200% YoY growth can’t use such methodology
To make things easier, we sometimes also use the $500,000 minimum ARR criteria, as we assume most of these companies fit the criteria mentioned above. Yet, for example, if your business has $1M ARR but grew 150% YoY, this methodology doesn’t work either.
Why fast growing SaaS businesses can’t use this methodology?
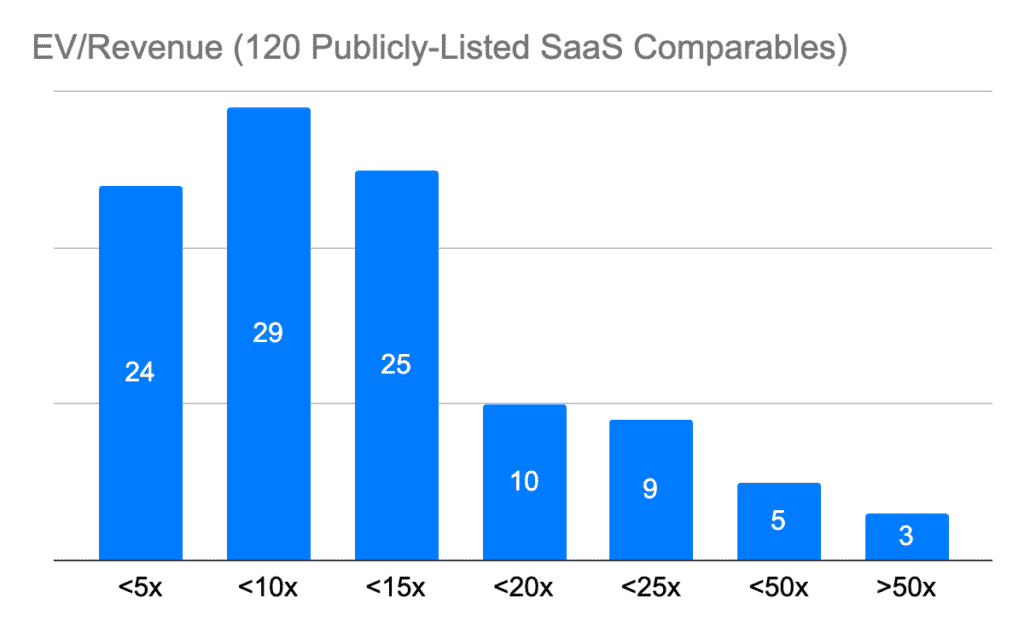
The valuation we discuss in this article is based on an analysis that takes into account over 1,000 metrics from 120+ publicly-listed SaaS and Software businesses. Yet, since most of these comparables report a revenue growth between 10-50% YoY (see chart below), extrapolating their metrics to value SaaS businesses growing at triple digits (e.g. 150% YoY for example) can easily be inaccurate.

Why Public Comparables Work For SaaS Valuation
Hopefully everyone should be knowledgeable about what is a multiple valuation. If not, here you go:
What is a multiple valuation?
A multiple valuation is a methodology whereby we use comparable companies’ metrics and valuation to estimate the valuation of a company.
Comparable companies are businesses that operate in a similar environment and/or have a similar business model vs. the company we are trying to value. Because we consider our company to be similar to this subset of comparables, we can extrapolate valuation from theirs.
The valuations from these comparables is then divided by the metrics to obtain a multiple. The metrics used can be financials (e.g. revenues, EBITDA, net profit) or non-financial (number of customers, orders, etc.).
For instance, let’s assume we try to value company A with $10M revenues. We consider company A to be similar to company X & Y with the following valuations and metrics:
- Company X: $15M revenues and $30M valuation. Its revenue multiple is 2.0x ($30M / $15M)
- Company Y: $35M revenues and $50M valuation. Its revenue multiple is 1.4x
By using the average multiple of the 2 comparables, we obtain a ~1.7x revenue multiple. Therefore, we can argue here that company A should be valued ~$17M.
Precedent transactions vs. trading multiples
There are 2 separate multiple valuation methodologies, precedent transactions and public (or trading) comparables:
- Precedent transactions uses the multiples obtained from comparable transactions (M&A transactions within the same vertical for instance). This approach is quite accurate as the companies’ multiples are the direct result of the valuation agreed between the seller and the buyer. Yet, the downside is the lack of information: over 95% of transactions don’t publicly disclose any valuation and/or any metric that would allow us to calculate a multiple (revenues for instance). Worse, when dealing with startups, there is often no other metric than the number of customers, at best
- Public (trading) comparables instead use the publicly available valuation and financial metrics of publicly-listed companies. As such, multiples can be obtained easily, for a large number of metrics (financials and operational) and are usually quite recent (latest quarter). Although information is here transparent, the main issue is that, unlike some precedent transactions, publicly listed companies aren’t at all the same scale vs. startups. Therefore, they aren’t necessarily comparable, and using their metrics to assess a startup valuation can easily be inaccurate
Why trading comparables work for SaaS
As discussed in our case study here, public comparables can be used in a number of cases to value certain startups. Again, by startup we refer in this article to companies with at least 3 years of historical financial and a resilient growth rate (under +100% YoY growth to be conservative).
Good news is: public comparables can be used to value SaaS, Enterprise SaaS and Software companies in general. Investors do it every day. But why is that so?
The short explanation is that these companies all share the same revenue model: a subscription revenue model. This means that, other things being equal, revenues are far more predictable for these businesses vs. any other business.
No need to remind you that SaaS businesses, especially B2B Enterprise and Software businesses, have standard billing cycles (e.g. monthly, quarterly, annual) and, most often than not, long-term contract clauses. There are, of course, other factors at play, yet in general subscription businesses are far more predictable vs. other one-off businesses (ecommerce, marketplaces, retail, etc.).
So, by using trading comparables, despite their scale, we can obtain multiples that also apply to much smaller, early-stage SaaS businesses.
But, what multiple do we use to value SaaS? Like any other early-stage business, investors will almost always use a Revenue (or ARR) multiple. Let’s see now how to get yours.
SaaS Valuation: How To Estimate Your Revenue Multiple?
If you look at publicly-listed SaaS comparables, you might wonder why they’re trading anywhere from 2x to 25x their revenues, some even trade at 100x..! So, naturally, you might question how relevant they are when valuing your SaaS business.
Well, the answer lies into this:
SaaS EV/Revenue multiple is a direct function of ARR growth and cash flow profitability
In other words, a $10M ARR SaaS with 20% YoY growth and -20% FCF margin will not have the same EV/Revenue multiple vs. another $10M SaaS with 20% YoY growth and 0% FCF margin.
It might sound obvious, but this correlation can actually be proven by a formula we can use to value any SaaS business. Let’s see now how.
SaaS Financial Model
Download an expert-built 5-year Excel financial model for your pitch deck
SaaS Financial Model
Download an expert-built 5-year Excel financial model for your pitch deck
Introducing The Rule of 40
The rule of 40 is a common metric that most Private Equity, Growth Equity and Venture Capital investors use to assess the performance of SaaS companies. It’s called the Rule of 40 as investors consider a SaaS business to have a “healthy” growth when its value is equal or above 40.
The Rule of 40 takes into account 2 factors:
- Revenue growth can be LTM YoY growth or ARR growth
- Profitability can either be EBITDA margin, Operating Cash Flow margin or Free Cash Flow margin
For example, let’s assume a SaaS business with:
- 30% YoR ARR Growth
- $20M ARR and -$3M FCF: -15% FCF margin
Therefore, its rule of 40 is 30% – 15% = 15%. So this business wouldn’t be considered healthy in regards to the Rule of 40 rule. In comparison, the same business with 30% YoY ARR and $2M FCF would end up with a 40% ratio.
The Rule of 40 is powerful because it takes into account both growth and cash flow profitability.
What’s more important is that it does give credit to high-growth businesses despite the fact that they might still be unprofitable (because of their investment in growth e.g. customer acquisition for instance). Conversely, a low-growth SaaS company (say +4% YoY) with high FCF margin (say 30%) might be more valuable than a +100% YoY SaaS with significant negative cash flows.

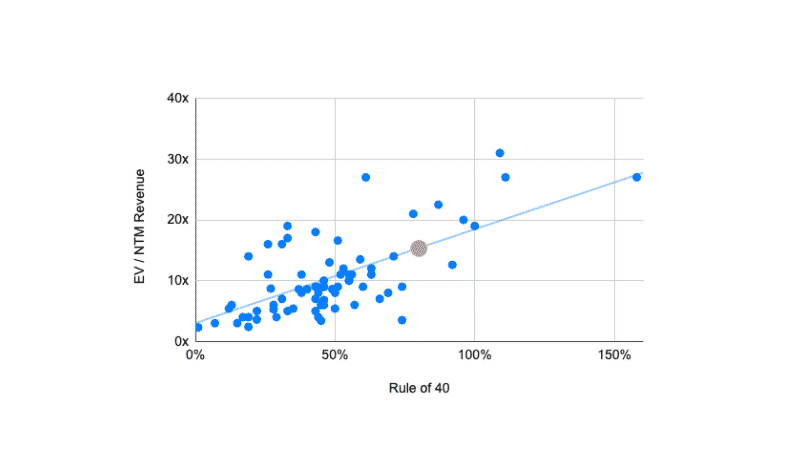
The Equation That Rules Them All
As we explained earlier, the EV/Revenue (or EV/ARR) multiple for SaaS businesses is a function of revenue growth and cash flow profitability. This can (easily) be proven mathematically with a linear regression.
Actually, we often use 2 separate linear regressions, to minimise the margin of error. Each linear regression is obtained by plotting publicly-listed companies on a chart with 2 axes.
The 2 linear regression are:
- EV/Revenue and Revenue Growth (ARR YoY growth)
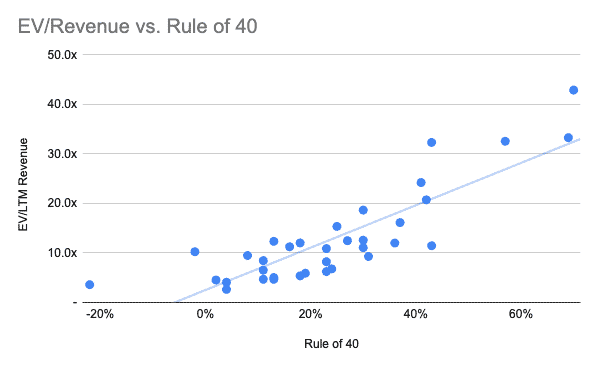
- EV/Revenue and the Rule of 40
This is what we finally obtain:
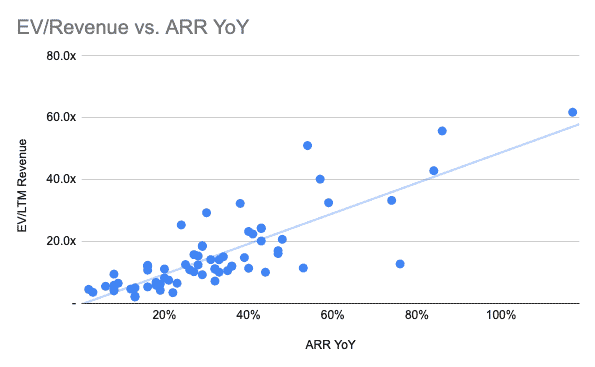
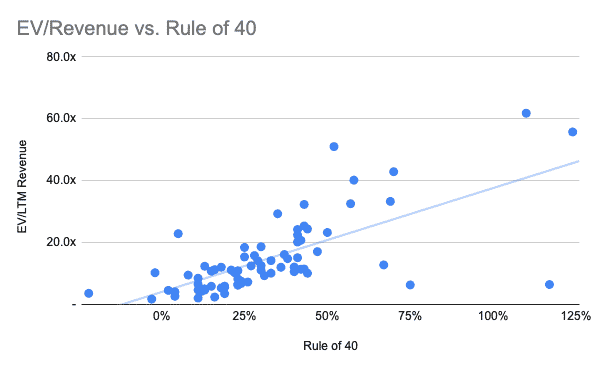
Those knowledgeable about linear regressions and statistics overall would easily understand the R-squared (R2) obtained from the 2 regressions, 0.68 and 0.48 respectively demonstrate strong positive correlation.
In other words, EV/Revenue can be obtained from either Revenue growth (ARR YoY growth) or FCF margin.
We at SharpSheets use both methodologies when estimating the valuation of SaaS businesses because, by doing so, we take into account both revenue growth and cash flow profitability, minimising the margin of error.
Indeed, there’s always a margin of error, that’s why considering the analysis above we recommend keeping a +/- 15% variance to be conservative. This means that, for example, if you obtain 10x for your company, you should use as a valuation range 8.7x to 11.5x instead.
Adjusting For Interferences
For those who wanted to run the numbers, it’s important to note that to run this analysis we had to exclude a number of companies from the original set of 120 comparables. Down to 72 exactly.
Indeed we had to exclude:
- Companies with negative YoY ARR growth; and
- Companies with share price that fell more than 60% vs. the highest of the past 52 weeks
On the latter, as of March 2022, all the SaaS valuations had indeed significantly fallen from their 2021 peaks. This means that a lot of publicly-listed SaaS companies are worth much less than what they were a year ago (see below).
For example:
- 5 companies had seen their share price decrease by more than 80% vs. their peak;
- 12 companies had seen their share price decrease by more than 70% (but less than 80%); and so on..
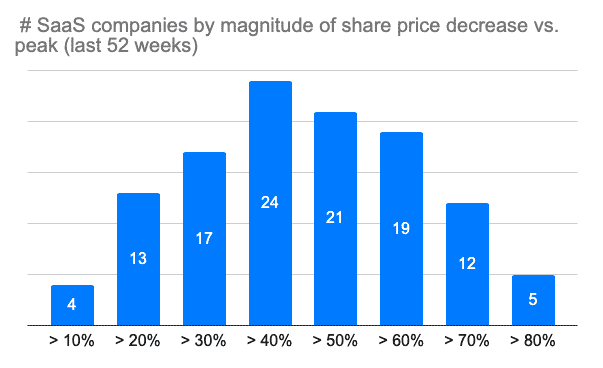
So, for the purpose of our analysis earlier, we excluded companies which share price decreased by more than 60%.
Adjusting Further
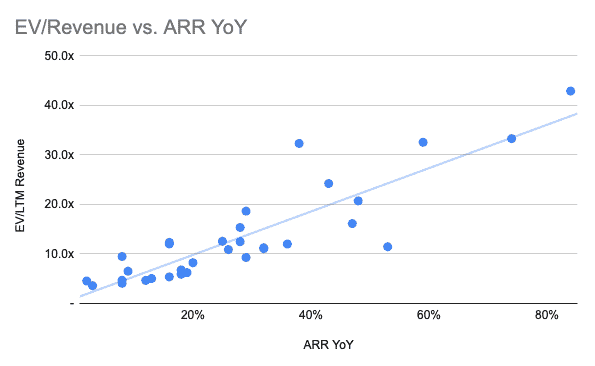
The correlation is all the more obvious when adjusting for these “fallen angels”. Indeed, assuming we would only include companies which share price decreased no more than 40% (and not 60%), we would instead obtain the linear regressions below.
Although the number of comparables is now much smaller (32 companies in total), we obtain a much stronger correlation: 0.77 and 0.72 respectively.
Disclaimer: All the data we are using for this analysis is publicly available. We have gathered over 1,000 metrics from 120 publicly-listed SaaS companies of which we offer a preview here.
Calculating Your SaaS Valuation
Hopefully by now it should be clear to any reader why SaaS ARR multiples vary often anywhere from 2x to 25x. Also, we explained what are the factors behind ARR multiples’ variations: revenue growth and cash flow profitability.
With this in mind, we can now estimate any SaaS valuation in a breeze.
Indeed, valuation is the result of the following equation:
Valuation = NTM Revenue x EV/Revenue x (1 – DLOM)
NTM Revenue is your expected next-twelve-months revenues. If you haven’t yet prepared a forecast for your SaaS company, have a look at our financial model templates for SaaS and Enterprise SaaS.
DLOM stands for Discount For Lack of Marketability. Most investors use 25% as rule of thumb. For more information on what DLOM is, see an article here.
Let’s see now how we get your EV/Revenue.
SaaS Financial Model
Download an expert-built 5-year Excel financial model for your pitch deck
SaaS Financial Model
Download an expert-built 5-year Excel financial model for your pitch deck
Finding Your EV/Revenue Multiple
This is probably the most important part of our article. To find your EV/Revenue multiple, we should use the 2 linear regressions discussed earlier.
Because linear regressions prove a mathematical relationship between 2 variables, we can infer the equation behind each linear regression which looks like this:
EV/Revenue = AX + B
Where A and B are given from the equation of the linear regressions, and X is either ARR YoY growth or your Rule of 40 ratio. We then obtain 2 different equations as follows:
ARR YoY method
A1 x ARR YoY growth + B1
Rule of 40 method
A2 x Rule of 40 + B2
How can you find (your) A & B?
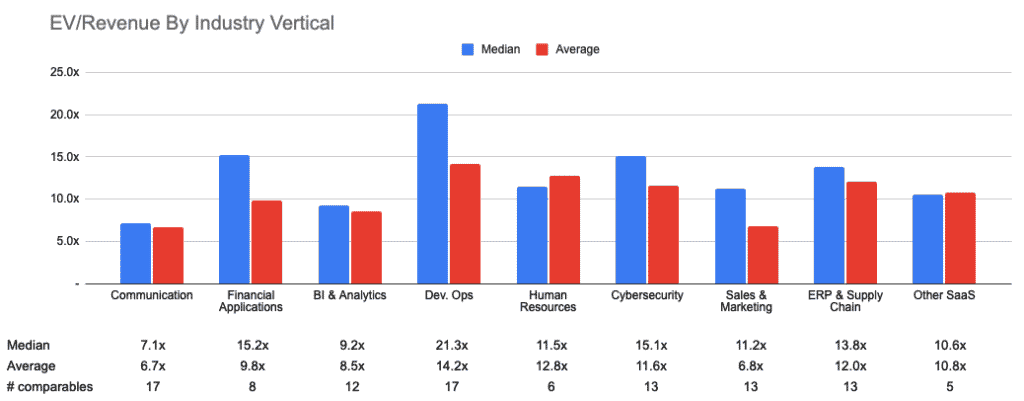
Finding the right valuation for your business requires you to select the right sample. Yes, you heard us right: looking at the 120 publicly-listed SaaS comparables (see the full list of metrics and valuation multiples here) to form a valuation for Dev Ops SaaS business isn’t 100% correct.
In other words, you can’t really value a Dev Ops SaaS with HR tech SaaS comparables for instance.
Indeed, this is evidenced by the chart below where we compared the average and median EV/Revenue multiples of our 120 SaaS companies by industry vertical. Not all verticals have the same EV/Revenue multiples.
What If We Disregard The SaaS Vertical?
Notwithstanding the different between SaaS verticals mentioned earlier, if we were to perform the analysis on the full set of 120 comparables, this is what the 2 equations would look like, using the 2 linear regressions explained earlier:
ARR YoY method
29 x ARR YoY growth + 2.5
Rule of 40 method
29 x Rule of 40 – 0.4
As you can see, the equations are surprisingly pretty similar. This is due to 2 main factors:
- Rule of 40 also takes into account ARR YoY growth
- The set of 120 comparables is very large, minimising margin of error
Case Study
Let’s assume we are trying to value a B2B SaaS company in the communication industry, with the financials below:
- $10M NTM Revenue
- 30% ARR YoY growth
- 5% FCF margin
- 35% Rule of 40 ratio
By following the same methodology, assuming we select 25 publicly-listed comparables from the SaaS Communication vertical, and we obtain the 2 equations below:
ARR YoY method
A1 x ARR YoY growth + B1
= 49 x 30% – 2
= 12.7x
Rule of 40 method
A2 x Rule of 40 + B2
= 33 x 35% + 4
= 15.5x
Using the weighted average of the 2 methods, we obtain 14.1x EV/Revenue multiple for that company. Now the valuation is: