Are Cinnabon Franchises Profitable? Costs & Profits (2023)
With 1,600 stores worldwide, Cinnabon is one of the most popular bakery and sweets franchises. On average, you would need to invest $276,062 upfront as the franchisee and your Cinnabon store would generate $394,897 in sales per year.
Is this a profitable investment? In this article we’re looking at Cinnabon franchises and the information available in their latest Franchise Disclosure Document.
We’ll answer questions like: how much you can make with this business, how much it really costs and whether you should start a Cinnabon franchise. Let’s find out!
Key stats
Franchise fee | $30,500 |
Royalty fee | 6.0% |
Marketing fee | 4.0% |
Investment (mid-point) | $323,000 |
Average sales | $461,000 |
Sales to investment ratio | 1.4x |
Payback period* | 6 years |
Minimum net worth | $300,000 |
Minimum liquid capital | $120,000 |
What is Cinnabon?
Cinnabon is an American chain of bakeries and baked goods shops synonymous with its signature cinnamon roll. The chain was founded in 1985 in Seattle, Washington, by Rich Komen and his son, Greg Komen.
Its menu includes cinnamon rolls, coffee, milkshakes, and churros. Cinnabon locations are commonly found in high-traffic areas such as malls, airports, and rest stops.
Cinnabon began franchising in 1986 and opened its first franchise in Pennsylvania. It is owned by Focus Brands Inc., headquartered in Sandy Springs, Georgia.
Cinnabon now has over 1,600 locations in the United States and 50 other countries.
Cinnabon franchises pros and cons
Pros
- Franchise training: Cinnabon has in place a comprehensive training support team and digital resources that help franchisees, their designated managers, and employees learn all they need to operate and manage a successful and profitable bakery.
- Aggressive marketing: The brand offers franchisees a dedicated marketing and public relations team to help them with the best local media and marketing plans in their locations. With an innovative and targeted marketing team, franchisees are guaranteed success.
- Purchasing power: The franchisees can leverage the brand’s international supply channel and enjoy economies of scale by acquiring quality, regulated inventories at reasonable commercial prices.
- Universal brand recognition: The brand has bakeries in more than 50 countries, and it’s still growing. Franchisees can join the most well-known cinnamon roll brand and have the opportunity to grow in markets where the brand is present.
- Real estate and construction: Cinnabon offers franchisees real estate experts to help in the construction. They assist in site selection, bakery construction, design, and branding. They also provide a dedicated leasing team to help franchisees identify real estate opportunities and negotiate the lease.
- Flexible franchise models: Cinnabon has different flexible franchise models that franchisees can choose from. These include full bakeries, express bakeries, concession bakeries, Auntie Anne’s branded bakeries, and Carvel co-branded bakeries. Therefore, franchisees can start a bakery that fits their budget.
- Operations and field support: The brand provides franchisees with a passionate and dedicated support team. Franchisees get access to initial management training, on-site bakery visits, security and safety procedures, review, and performance analyses by corporate management teams.
- Product development: The Cinnabon brand enjoys world-class quality and a varied menu. It keeps improving on this and expanding the menu to accommodate different demands and new customer tastes through testing and experimenting with new flavors.
Cons
- No exclusive territory granted: The brand does not offer franchisees exclusive territory protection. Therefore, franchisees may face competition from other Cinnabon bakeries.
- No financing: The franchisor does not offer direct or indirect financing to franchisees. It also does not guarantee any lease, obligation, or note for any lenders. Franchisees must seek third-party financing or SBA loans to fund their trade fixtures, inventory, or other needs.
- Prior restaurant chain experience: The brand requires franchisees to have past business experience as restaurant owners or operators.
How much does a Cinnabon franchise cost?
You need to invest around $323,000 to start a Cinnabon bakery, on average.
The investment amount will vary depending on your type of bakery. As per the latest Franchise Disclosure Document, a Carvel co-Branded bakery ($658,000) requires 5 times as much investment than an Express bakery ($111,000).
So before you prepare a business plan for a Cinnabon bakery, make sure to understand what are the different costs you will incur for the format of bakery you would go for.
See below the average investment required to open a Cinnabon bakery for all bakery formats:
As you can see, you would need to invest as low as $22,800 to as high as $883,900, depending on your choice of bakery type.
Bakery format | Low | High | Average |
---|---|---|---|
Full bakery – traditional location | 232,400 | 621,400 | 426,900 |
Full bakery – non-traditional location | 155,400 | 544,200 | 349,800 |
Express bakery | 60,300 | 162,450 | 111,375 |
Express bakery in a new schlotzsky’s restaurant | 22,800 | 48,100 | 35,450 |
Concession bakery – food truck | 149,200 | 284,100 | 216,650 |
Concession bakery – trailer | 109,200 | 230,100 | 169,650 |
Auntie Anne’s co-branded bakery | 352,075 | 879,400 | 615,738 |
Carvel co-branded bakery | 431,200 | 883,900 | 657,550 |
Total | 322,889 |
When it comes to the cost breakdown, the investment covers all type of startup costs needed for a bakery business. In addition to a franchise fee ($5,500 – $66,000), you would also pay for costs like:
- Pre-opening costs: permitting, legal and accounting fees, security deposits, training and support fees, travel and living expenses during training, etc.
- Build-out costs: construction, equipment package, millwork, furniture, menu board, graphics and interior signage, exterior signage, computer system, small wares, architect/engineer, etc.
- Marketing fees: grand opening marketing
- Operating expenses: first month’s rent, insurance, office supplies, opening inventory, and working capital for first 3 months, etc.
How much sales can you make with a Cinnabon?
On average, a Cinnabon franchise makes $461,000 in sales per year.
This sales number is the average annual median net sales of all 457 franchised bakeries operating in 2022 which include all types of franchises. The average sales vary depending on the bakery format as you can see below:
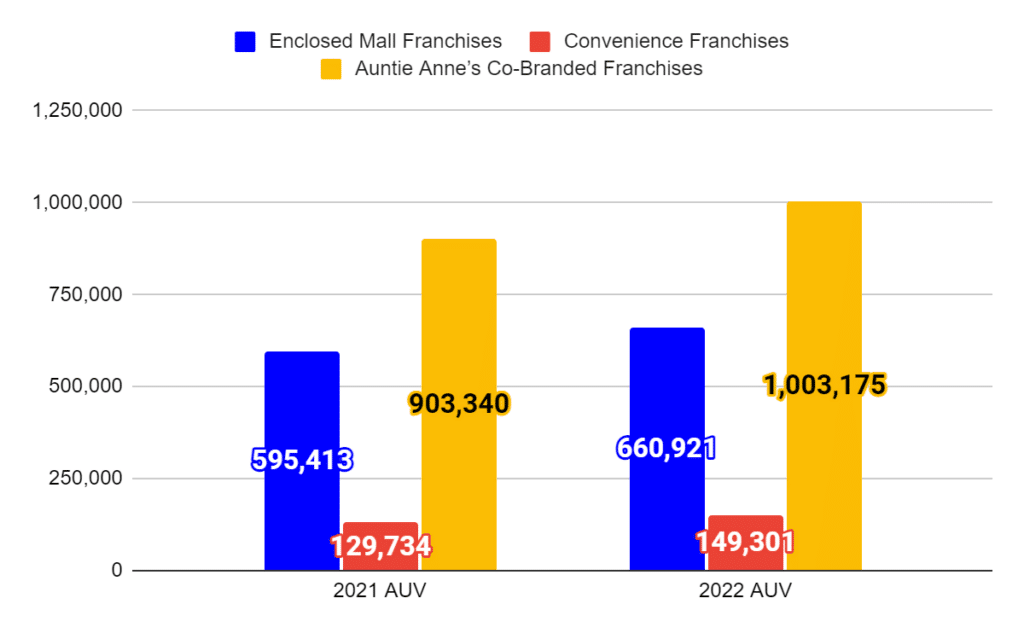
Bakery format | Number of restaurants | 2021 AUV | Number of restaurants | 2022 AUV |
---|---|---|---|---|
Enclosed Mall Franchises | 169 | 595,413 | 188 | 660,921 |
Convenience Franchises | 216 | 129,734 | 215 | 149,301 |
Auntie Anne’s Co-Branded Franchises | 46 | 903,340 | 54 | 1,003,175 |
Total | 431 | 394,898 | 457 | 460,666 |
How profitable is a Cinnabon franchise?
On average, a Cinnabon franchise makes $58,163 in profits per year. That means you may expect a 15% adjusted EBITDA margin.
Be careful here: this adjusted EBITDA is not as same as net profit. From EBITDA, you must also deduct taxes, debt interest expenses, and other costs to get to net profit.
The 15% adjusted EBITDA margin is on the lower end compared to similar franchises as per our intelligence (~25-27% industry average). We assume the reason for this is the high rent expense (21.3% sales vs. 8% industry average).
Also consider that we used the industry average for COGS (25% sales) and labor costs (29%) as Cinnabon doesn’t disclose any financial information regarding costs in its FDD.
Profit-and-loss | Amount ($) | As % of sales |
---|---|---|
Sales | $394,897 | 100% |
COGS | $(98,724) | 25.0%* |
Labor | $(114,520) | 29.0%* |
Rent | $(84,000) | 21.3% |
Royalty + marketing fees | $(39,490) | 10.0% |
Adjusted EBITDA | $58,163 | ~15% |
Is a Cinnabon a good investment?
So should you start a Cinnabon franchise? To answer this question, we need to look at the payback period: the time it takes for an investment to pay itself back, from the profits it generates.
Assuming a net profit margin of 12% (as EBITDA margin is already 15%), we found that the payback period for a Cinnabon franchise is 5.8 years, which is average.
Think about it: you would have to wait on average 5.8 years for your initial investment (the $276,062) to be reimbursed with the profits. So only after 6 years you would actually make money on your investment, as the franchisee / shareholder.
If you’re applying for a Cinnabon franchise, prepare a solid business plan with our template below. We’ve already built your financial plan, using the latest Franchise Disclosure Document numbers. Download your 3 pro forma financial statements, visualize your breakeven point and more.
How does it compare vs. other franchises?
Franchise | Investment ($) | Sales ($) | Payback (years) | Min. net worth ($) | Min. liquid capital ($) | |||
---|---|---|---|---|---|---|---|---|
Chick-Fil-A | https://sharpsheets.io/blog/chick-fil-a-franchise-costs-profits/ | Chicken | 1,363,510 | 4,227,417 | 3.1 | 2.2 | - | - |
Dunkin' Donuts | https://sharpsheets.io/blog/dunkin-donuts-franchise-costs-profits/ | Donuts | 779,000 | 1,056,521 | 1.4 | 4.9 | 500,000 | 250,000 |
Domino's | https://sharpsheets.io/blog/dominos-franchise-profits-costs/ | Pizza | 398,725 | 1,286,428 | 3.2 | 3.9 | 250,000 | 75,000 |
Krispy Kreme | https://sharpsheets.io/blog/krispy-kreme-franchise-costs-profits/ | Donuts | 824,000 | 3,400,000 | 4.1 | 1.6 | 2,000,000 | 300,000 |
Little Caesars | https://sharpsheets.io/blog/little-caesars-franchise-costs-profits/ | Pizza | 1,022,850 | 798,113 | 0.8 | 8.5 | 350,000 | 150,000 |
Wingstop | https://sharpsheets.io/blog/wingstop-franchise-costs-profits/ | Chicken | 631,695 | 1,460,459 | 2.3 | 2.9 | 1,200,000 | 600,000 |
Steak 'n Shake | https://sharpsheets.io/blog/steak-n-shake-franchise-costs-profits/ | Burger, Milshakes | 815,626 | 1,346,332 | 1.7 | 4.0 | 1,500,000 | 500,000 |
Crumbl Cookies | https://sharpsheets.io/blog/crumbl-cookie-franchise-cost-profits/ | Sweets | 507,224 | 1,582,090 | 3.1 | 2.1 | 300,000 | 150,000 |
Taco Bell | https://sharpsheets.io/blog/taco-bell-franchise-costs-profits/ | Mexican | 462,413 | 1,650,000 | 3.6 | 1.9 | 1,500,000 | 750,000 |
Popeyes | https://sharpsheets.io/blog/popeyes-franchise-costs-profits/ | Chicken | 1,095,783 | 1,444,617 | 1.3 | 5.1 | 1,000,000 | 500,000 |
Smoothie King | https://sharpsheets.io/blog/smoothie-king-franchise-costs-profits/ | Smoothie | 688,108 | 573,269 | 0.8 | 8.0 | 300,000 | 100,000 |
Jersey Mike's | https://sharpsheets.io/blog/jersey-mikes-franchise-costs-profits/ | Sandwich | 574,323 | 1,220,586 | 2.1 | 4.7 | 300,000 | 100,000 |
Nothing Bundt Cakes | https://sharpsheets.io/blog/nothing-bundt-cakes-franchise-costs-profits/ | Sweets | 538,650 | 1,307,280 | 2.4 | 2.7 | 600,000 | 150,000 |
Jimmy John's | https://sharpsheets.io/blog/jimmy-johns-franchise-costs-profits/ | Sandwich | 513,650 | 874,845 | 1.7 | 3.9 | 300,000 | 80,000 |
Texas Roadhouse | https://sharpsheets.io/blog/texas-roadhouse-franchise-costs-profits/ | Steakhouse | 4,209,500 | 2,955,534 | 0.7 | 9.5 | n.a. | 200,000 |
Kung Fu Tea | https://sharpsheets.io/blog/kung-fu-tea-franchise-costs-profits/ | Bubble tea | 250,125 | 353,237 | 1.4 | 4.7 | n.a. | 25,000 |
Wendy’s | https://sharpsheets.io/blog/wendys-franchise-cost-profits/ | Burger | 1,374,833 | 1,791,231 | 1.3 | 5.1 | 1,000,000 | 500,000 |
Burger King | https://sharpsheets.io/blog/burger-king-franchise-costs-profits/ | Burger | 1,242,950 | 1,215,970 | 1.0 | 6.8 | 1,500,000 | 500,000 |
Sonic Drive-In | https://sharpsheets.io/blog/sonic-drive-in-franchise-costs-profits/ | Burger | 1,467,083 | 1,617,000 | 1.1 | 6.0 | 1,000,000 | 500,000 |
Panera Bread | https://sharpsheets.io/blog/panera-bread-franchise-costs-profits/ | Sandwich | 2,290,500 | 2,599,432 | 1.1 | 5.9 | 7,500,000 | 3,000,000 |
Pizza Hut | https://sharpsheets.io/blog/pizza-hut-franchise-costs-profits/ | Pizza | 935,575 | 906,911 | 1.0 | 6.9 | 700,000 | 350,000 |
KFC | https://sharpsheets.io/blog/kfc-franchise-costs-profits/ | Chicken | 1,802,050 | 1,567,474 | 0.9 | 7.7 | 1,500,000 | 750,000 |
Arby’s | https://sharpsheets.io/blog/arbys-franchise-costs-profits/ | Sandwich | 1,184,975 | 1,126,263 | 1.0 | 7.0 | 1,000,000 | 500,000 |
Dairy Queen | https://sharpsheets.io/blog/dairy-queen-franchise-costs-profits/ | Ice Cream | 1,404,220 | 1,143,180 | 0.8 | 8.2 | 750,000 | 400,000 |
Jack in the Box | https://sharpsheets.io/blog/jack-in-the-box-franchise-costs-profits/ | Burger | 2,195,800 | 1,755,503 | 0.8 | 12.5 | 1,000,000 | 250,000 |
Papa John’s | https://sharpsheets.io/blog/papa-johns-franchise-costs-profits/ | Pizza | 353,695 | 1,101,127 | 3.1 | 2.1 | 750,000 | 250,000 |
Zaxby’s | https://sharpsheets.io/blog/zaxbys-franchise-costs-profits/ | Chicken | 534,750 | 2,229,187 | 4.2 | 2.4 | 1,000,000 | 500,000 |
Hardee’s | https://sharpsheets.io/blog/hardees-franchise-costs-profits/ | Burger | 1,759,000 | 1,147,975 | 0.7 | 10.2 | 1,000,000 | 300,000 |
Culver’s | https://sharpsheets.io/blog/culvers-franchise-costs-profits/ | Burger | 4,044,500 | 3,051,762 | 0.8 | 8.8 | 2,000,000 | 350,000 |
Five Guys | https://sharpsheets.io/blog/five-guys-franchise-costs-profits/ | Burger | 511,225 | 1,203,366 | 2.4 | 2.8 | 500,000 | 250,000 |
Carl’s Jr. | https://sharpsheets.io/blog/carls-jr-franchise-costs-profits/ | Burger | 1,860,335 | 1,419,516 | 0.8 | 8.7 | 1,000,000 | 500,000 |
Baskin-Robbins | https://sharpsheets.io/blog/baskin-robbins-franchise-costs-profits/ | Ice Cream | 465,100 | 316,815 | 0.7 | 9.8 | 250,000 | 125,000 |
IHOP | https://sharpsheets.io/blog/ihop-franchise-costs-profits/ | Pancakes | 2,058,302 | 1,553,311 | 0.8 | 8.8 | 1,500,000 | 500,000 |
Applebee’s | https://sharpsheets.io/blog/applebees-franchise-costs-profits/ | Casual American | 5,137,966 | 2,356,965 | 0.5 | 14.5 | 1,000,000 | 500,000 |
Denny's | https://sharpsheets.io/blog/dennys-franchise-costs-profits/ | Casual American | 3,785,459 | 1,639,549 | 0.4 | 15.4 | 1,000,000 | 500,000 |
Papa Murphy's | https://sharpsheets.io/blog/papa-murphys-franchise-costs-profits/ | Pizza | 433,174 | 580,441 | 1.3 | 5.0 | 275,000 | 125,000 |
Auntie Anne's | https://sharpsheets.io/blog/auntie-annes-franchise-costs-profits/ | Pretzels | 229,692 | 343,135 | 1.5 | 5.6 | 300,000 | 100,000 |
Firehouse Subs | https://sharpsheets.io/blog/firehouse-subs-franchise-costs-profits/ | Sandwich | 613,186 | 888,356 | 1.4 | 4.6 | 350,000 | 100,000 |
Tropical Smoothie Cafe | https://sharpsheets.io/blog/tropical-smoothie-cafe-franchise-costs-profits/ | Smoothie | 430,500 | 961,969 | 2.2 | 3.0 | 350,000 | 125,000 |
Marco’s Pizza | https://sharpsheets.io/blog/marcos-pizza-franchises-costs-profits/ | Pizza | 437,625 | 895,523 | 2.0 | 3.3 | 400,000 | 100,000 |
Cinnabon | https://sharpsheets.io/blog/cinnabon-franchises-costs-profits/ | Sweets | 276,062 | 394,897 | 1.4 | 5.8 | 300,000 | 120,000 |
Cold Stone Creamery | https://sharpsheets.io/blog/cold-stone-creamery-franchise-costs-profits/ | Ice Cream | 310,956 | 417,588 | 1.3 | 5.0 | 250,000 | 100,000 |
Jamba | https://sharpsheets.io/blog/jamba-franchise-costs-profits/ | Smoothie | 414,562 | 597,028 | 1.4 | 7.7 | 300,000 | 100,000 |
Church’s Chicken | https://sharpsheets.io/blog/churchs-texas-chicken-fees-sales-costs/ | Chicken | 1,195,147 | 1,395,088 | 1.2 | 5.7 | 1,000,000 | 300,000 |
Moe’s Southwest Grill | https://sharpsheets.io/blog/moes-southwest-grill-franchises-costs-profits/ | Mexican | 792,370 | 1,013,361 | 1.3 | 5.2 | 1,000,000 | 100,000 |
Tim Hortons | https://sharpsheets.io/blog/tim-hortons-franchises-costs-profits/ | Coffee | 1,242,750 | 1,188,240 | 1.0 | 7.0 | 500,000 | 100,000 |
Checkers & Rally's | https://sharpsheets.io/blog/checkers-franchises-profits-sales-costs/ | Burger | 837,847 | 1,039,773 | 1.2 | 5.4 | 750,000 | 250,000 |
Charleys Philly Steaks | https://sharpsheets.io/blog/charleys-philly-steaks-costs-profits/ | Sandwich | 509,806 | 786,233 | 1.5 | 4.3 | 500,000 | 100,000 |
Buffalo Wild Wings | https://sharpsheets.io/blog/buffalo-wild-wings-costs-profits/ | Chicken | 3,546,900 | 2,534,148 | 0.7 | 9.3 | 1,500,000 | 750,000 |
Rita's Ice | https://sharpsheets.io/blog/ritas-ice-franchise-costs-profits/ | Ice Cream | 215,839 | 248,340 | 1.2 | 5.8 | 300,000 | 100,000 |
A&W Restaurants | https://sharpsheets.io/blog/aw-restaurants-franchises-costs-profits/ | Burger | 786,750 | 851,212 | 1.1 | 6.2 | 350,000 | 150,000 |
Hungry Howie’s Pizza | https://sharpsheets.io/blog/hungry-howies-pizza-franchise-costs-profits/ | Pizza | 419,682 | 806,899 | 1.9 | 3.5 | 750,000 | 200,000 |
Bojangles | https://sharpsheets.io/blog/bojangles-franchise-costs-profits/ | Chicken | 1,658,000 | 1,801,057 | 1.1 | 6.1 | 1,000,000 | 500,000 |
McAlister’s Deli | https://sharpsheets.io/blog/mcalister-deli-franchise-costs-profits/ | Sandwich | 1,424,963 | 1,865,861 | 1.3 | 5.1 | 1,000,000 | 500,000 |
Round Table Pizza | https://sharpsheets.io/blog/round-table-pizza-franchise-costs-profits/ | Pizza | 783,250 | 1,037,816 | 1.3 | 5.0 | 500,000 | 200,000 |
Qdoba Mexican Eats | https://sharpsheets.io/blog/qdoba-mexican-eats-franchise-costs-profits/ | Mexican | 659,250 | 972,962 | 1.5 | 4.5 | ||
Freddy’s | https://sharpsheets.io/blog/freddys-franchise-costs-profits/ | Burger | 1,453,040 | 1,792,929 | 1.2 | 5.4 | 1,000,000 | 400,000 |
Taco John’s | https://sharpsheets.io/blog/taco-johns-franchise-costs-profits/ | Mexican | 1,119,000 | 1,124,980 | 1.0 | 6.6 | 1,000,000 | 400,000 |
Scooter’s Coffee | https://sharpsheets.io/blog/scooters-coffee-franchise-costs-profits/ | Coffee | 1,143,250 | 797,101 | 0.7 | 9.6 | 500,000 | 200,000 |
Einstein Bros. Bagels | https://sharpsheets.io/blog/einstein-bros-bagels-franchise-costs-profits/ | Sandwich | 750,075 | 885,011 | 1.2 | 5.7 | 1,000,000 | 536,500 |
Great American Cookies | https://sharpsheets.io/blog/great-american-cookies-franchise-costs-profits/ | Sweets | 385,275 | 452,771 | 1.2 | 5.7 | 250,000 | 100,000 |
Wienerschnitzel | https://sharpsheets.io/blog/wienerschnitzel-franchise-costs-profits/ | Hot dogs | 873,300 | 880,980 | 1.0 | 6.6 | 600,000 | 250,000 |
Blaze Pizza | https://sharpsheets.io/blog/blaze-pizza-franchise-costs-profits/ | Pizza | 865,450 | 1,096,432 | 1.3 | 7.9 | 500,000 | 300,000 |
Wetzel's Pretzels | https://sharpsheets.io/blog/wetzels-pretzels-franchise-costs-profits/ | Pretzels | 377,571 | 748,857 | 2.0 | 3.4 | 300,000 | 50,000 |
Pizza Ranch | https://sharpsheets.io/blog/pizza-ranch-franchise-costs-profits/ | Pizza | 3,268,300 | 1,174,088 | 0.4 | 18.6 | 1,000,000 | 297,000 |
Del Taco | https://sharpsheets.io/blog/del-taco-franchise-costs-profits/ | Mexican | 1,406,850 | 1,345,341 | 1.0 | 7.0 | 2,000,000 | 500,000 |
Schlotzsky’s | https://sharpsheets.io/blog/schlotzskys-franchises-costs-profits/ | Healthy, Salads | 1,102,933 | 1,053,333 | 0.3 | 22.2 | 1,000,000 | 300,000 |
Captain D’s | https://sharpsheets.io/blog/captain-ds-franchise-profits-costs/ | Seafood | 982,778 | 1,067,816 | 0.4 | 19.0 | 1,000,000 | 350,000 |
Biggby Coffee | https://sharpsheets.io/blog/biggby-coffee-franchise-profits-costs/ | Coffee | 310,575 | 648,352 | 0.3 | 20.0 | 300,000 | 100,000 |
Which Wich | https://sharpsheets.io/blog/which-wich-franchises-profits-costs/ | Sandwich | 330,375 | 281,886 | 0.3 | 22.2 | 500,000 | 150,000 |
Marble Slab Creamery | https://sharpsheets.io/blog/marble-slab-franchises-costs-profits/ | Ice Cream | 407,360 | 251,052 | 0.4 | 16.7 | 250,000 | 100,000 |
Mountain Mike's Pizza | https://sharpsheets.io/blog/mountain-mikes-franchise-profits-costs/ | Pizza | 410,900 | 865,713 | 0.3 | 20.0 | 300,000 | 100,000 |
Huddle House | https://sharpsheets.io/blog/huddle-house-franchise-cost-profits/ | Diner | 988,743 | 712,428 | 0.5 | 13.3 | 600,000 | 300,000 |
L&L Hawaiian Barbecue | https://sharpsheets.io/blog/ll-hawaiian-barbecue-franchises-costs-profits/ | BBQ | 334,350 | 612,921 | 0.3 | 33.3 | 500,000 | 150,000 |
Chicken Salad Chick | https://sharpsheets.io/blog/chicken-salad-chick-franchises-costs-profits/ | Healthy, Salads | 651,000 | 1,202,020 | 0.3 | 20.0 | 750,000 | 250,000 |
Golden Chick | https://sharpsheets.io/blog/golden-chick-franchises-costs-profits/ | Chicken | 362,975 | 917,609 | 2.5 | 2.6 | 2,000,000 | 425,000 |
Perkins | https://sharpsheets.io/blog/perkins-franchise-costs-profits/ | Diner | 1,922,728 | 1,729,246 | 0.9 | 7.4 | 1,500,000 | 500,000 |
Waba Grill | https://sharpsheets.io/blog/waba-grill-franchises-costs-profits/ | Teryaki | 454,000 | 466,536 | 1.0 | 6.5 | 1,000,000 | 250,000 |
Bruster’s Ice Cream | https://sharpsheets.io/blog/brusters-franchises-profits-costs/ | Ice Cream | 663,925 | 466,696 | 0.7 | 9.5 | 375,000 | 150,000 |
Disclaimer: This content has been made for informational and educational purposes only. We do not make any representation or warranties with respect to the accuracy, applicability, fitness, or completeness of the information presented in the article. You should not construe any such information or other material as legal, tax, investment, financial, or other professional advice. Nothing contained in this article constitutes a solicitation, recommendation, endorsement, advertisement, or offer to buy or sell any franchises, securities, or other financial instruments in this or in any other jurisdiction in which such solicitation or offer would be unlawful under the franchise and/or securities laws of such jurisdiction.
All content in this article is information of a general nature and does not address the detailed circumstances of any particular individual or entity. Nothing in the article constitutes professional and/or financial and/or legal advice, nor does any information in the article constitute a comprehensive or complete statement of the matters discussed or the law relating thereto. You alone assume the sole responsibility of evaluating the merits and risks associated with the use of any information or other content in this article before making any decisions based on such information or other content.