
Zaxby’s Franchise FDD, Profits & Costs (2026)
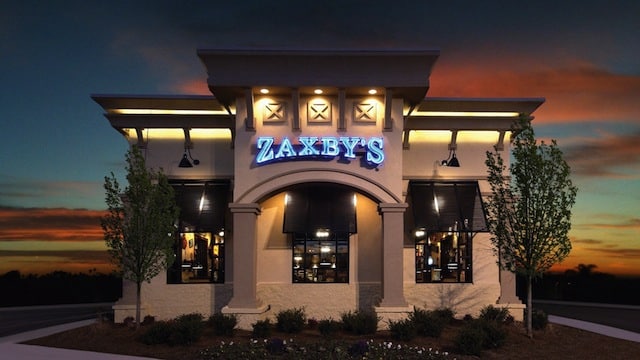
Zaxby’s, a fast-casual dining leader, was founded in 1990 by Zach McLeroy and Tony Townley in Statesboro, Georgia. Their mission was simple: serve high-quality chicken in a fun, engaging setting.
Headquartered in Athens, Georgia, Zaxby’s began franchising in 1994. This expansion brought its chicken-focused meals to new markets beyond its home state. The menu features popular items like Chicken Fingerz, wings, sandwiches, and the iconic Zax Sauce, all in a family-friendly environment.
What makes Zaxby’s stand out is its commitment to quality and customer experience. With flavorful sauces and “indescribably good” chicken, Zaxby’s has built a loyal customer base.

Initial Investment
How much does it cost to start a Zaxby’s franchise? It costs on average between $1,460,000 - $3,811,000 to start a Zaxby’s franchised restaurant.
This includes costs for construction, equipment, inventory, and initial operating expenses. The exact amount depends on various factors, including the type of restaurant you choose, the location, and whether the franchisee chooses to lease or purchase the property.
| Type of Expenditure | Amount |
|---|---|
| Initial Franchise Fee | $35,000 |
| Lease Deposit and Payment | $10,000 to $19,000 |
| Utility Deposits | $0 to $9,000 |
| Building | $640,000 to $1,300,000 |
| Sitework | $150,000 to $990,000 |
| Architect & Engineer | $45,000 to $110,000 |
| Permits and Licenses | $2,000 to $150,000 |
| Accounting and Legal Fees | $500 to $25,000 |
| Furniture, Fixtures & Equipment Package | $445,000 to $497,000 |
| Technology System | $75,000 to $217,500 |
| Signage | $23,000 to $245,000 |
| Insurance | $1,000 to $17,000 |
| Printing/Business Supplies | $300 to $1,000 |
| Initial Marketing Contribution | $5,200 to $10,000 |
| Initial Inventory | $5,000 to $22,000 |
| Uniforms | $1,500 to $5,000 |
| Training Expenses | $10,000 to $25,000 |
| Pre-Opening Payroll | $10,000 to $37,000 |
| Additional Funds – 3 Months | $1,000 to $96,000 |
| Total Estimated Initial Investment | $1,460,000 to $3,810,500 |
Zaxby’s Franchise Disclosure Document
Frequently Asked Questions
How many Zaxby’s locations are there?
As of the latest data, Zaxby’s operates approximately 1,005 restaurants across the United States. Of these, around 140 are company-owned, while the remaining 865 are franchised locations.
What is the total investment required to open a Zaxby’s franchise?
The total investment required to open a Zaxby’s franchise ranges from $1,460,000 - $3,811,000.
What are the ongoing fees for a Zaxby’s franchise?
Zaxby’s franchisees are required to pay a 6.00% royalty fee on gross sales. Additionally, there is a marketing fee of 4.00% of gross sales, which goes towards both national and local advertising campaigns. These ongoing fees are designed to support the brand’s growth and ensure consistent marketing efforts across all Zaxby’s locations.
Who owns Zaxby’s?
Zaxby’s is co-owned by its founders, Zach McLeroy and Tony Townley, along with Goldman Sachs, which acquired a significant stake in the company in 2020. While McLeroy remains involved in the leadership of the company, the partnership with Goldman Sachs has helped to fuel the brand’s expansion across the United States.
Disclaimer
Disclaimer: This content has been made for informational and educational purposes only. SharpSheets is an independent educational resource and is not affiliated with, endorsed by, or representing any franchisor mentioned on this website. Where noted, figures are taken from the franchisor’s Franchise Disclosure Document (FDD). In some cases, we may provide independent calculations or estimates based on publicly available information. We do not make any representation or warranties with respect to the accuracy, applicability, fitness, or completeness of the information presented in the article. You should not construe any such information or other material as legal, tax, investment, financial, or other professional advice. Nothing contained in this article constitutes a solicitation, recommendation, endorsement, advertisement, or offer to buy or sell any franchises, securities, or other financial instruments in this or in any other jurisdiction in which such solicitation or offer would be unlawful under the franchise and/or securities laws of such jurisdiction.
All content in this article is information of a general nature and does not address the detailed circumstances of any particular individual or entity. Nothing in the article constitutes professional and/or financial and/or legal advice, nor does any information in the article constitute a comprehensive or complete statement of the matters discussed or the law relating thereto. You alone assume the sole responsibility of evaluating the merits and risks associated with the use of any information or other content in this article before making any decisions based on such information or other content.


