
Franchise Investment Return Benchmarks by Segment: QSR, Home Services, Fitness, Senior Care, and Education
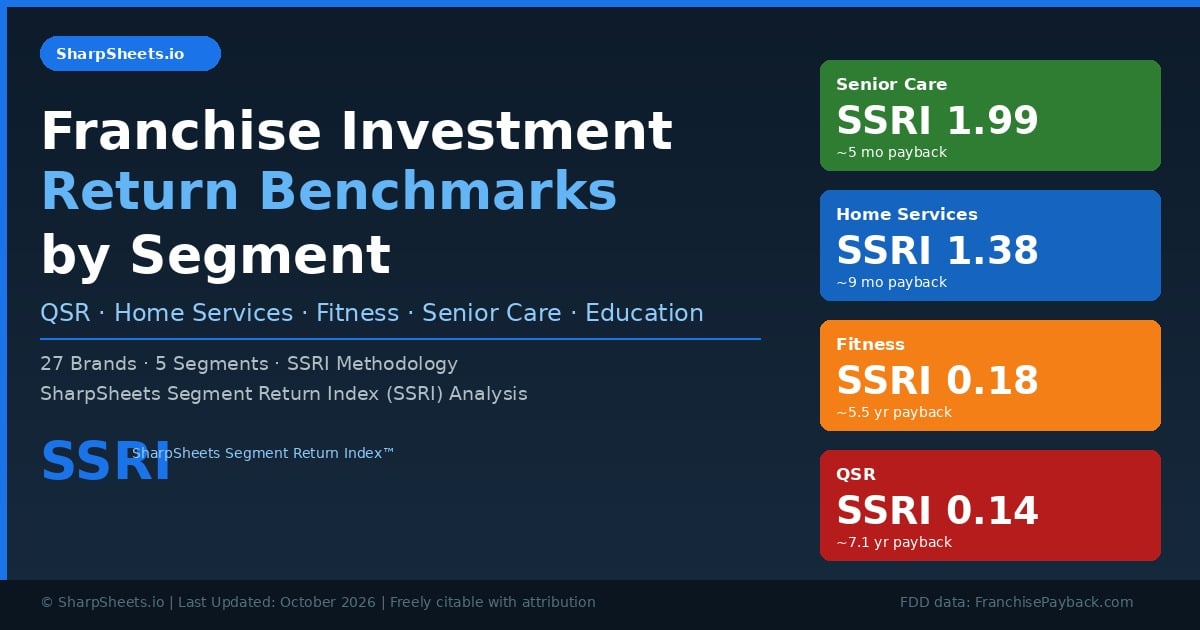
Senior care and home services franchises recover their full initial investment in under one year, while QSR and fitness franchises take 6–13 years to reach the same milestone. The SharpSheets Segment Return Index (SSRI), applied to 27 franchise brands across five segments using FDD Item 19 disclosed revenue and IFA-benchmarked net margin data, shows a 14:1 spread between the best- and worst-performing segments on capital efficiency. Knowing your segment before you sign the FDD is the most important financial decision you will make as a franchise buyer.
Last Updated: October 2026 | SharpSheets Editorial Team
For FDD fee structures, Item 7 investment cost breakdowns, and Item 19 raw disclosures on specific brands analyzed in this report, visit our sister site: FranchisePayback.com. This report covers what FranchisePayback does not: the owner income and capital return layer.
📊 Download: Free Franchise Return Benchmarks CSV + SharpSheets SSRI Methodology PDF →
📋 Key Statistics — Cite Freely With Attribution to SharpSheets
- Senior care franchises carry a median SSRI of 1.99 and pay back the initial investment in approximately 5–6 months at median disclosed revenue.
- Home services franchises generate a median SSRI of 1.38, with a payback period of approximately 8–9 months.
- QSR franchises carry a median SSRI of 0.141 and a median payback of 7.1 years — nearly 15× longer than senior care.
- Fitness franchises show the widest intra-segment spread: Club Pilates at SSRI 0.32 (3.1-year payback) vs. Planet Fitness at SSRI 0.089 (11+ years).
- Education franchises split into two sub-segments: tutoring centers (SSRI 0.72–1.39, payback 0.7–1.4 yrs) and childcare centers (SSRI 0.05–0.15, payback 7–20 yrs).
- Across all five segments, the median initial investment ranges from $73K (Kumon) to $5.5M (Primrose Schools) — a 75:1 spread.
Source: SharpSheets SSRI analysis of 27 brands. FDD Item 19 revenue data where disclosed; segment benchmarks from IFA Annual Franchise Economic Report and BLS NAICS industry data. See Methodology section.
| Segment | Brands Analyzed | Median Investment | Typical Owner Income/yr | Median SSRI | Median Payback |
|---|---|---|---|---|---|
| Senior Care | 5 | $74K–$195K | $198K–$462K | 1.99 | ~5 months |
| Home Services | 6 | $100K–$410K | $190K–$413K | 1.38 | ~9 months |
| Education (Tutoring) | 4 | $73K–$200K | $72K–$189K | 0.72 | ~1.4 yrs |
| Fitness | 5 | $197K–$5.1M | $98K–$293K | 0.163 | ~6.5 yrs |
| QSR | 7 | $229K–$5.6M | $34K–$296K | 0.141 | ~7.1 yrs |
Sources: FDD Item 19 disclosures, IFA Annual Franchise Economic Report, BLS NAICS industry benchmarks. SSRI = (Median Revenue × Net Margin Benchmark) ÷ Midpoint Investment. See Methodology.
Executive Summary: The Capital Efficiency Gap Across Franchise Segments
The franchise industry’s $850 billion in annual U.S. economic output obscures a critical truth: not all franchise segments are built the same way financially. A prospective buyer evaluating a home services opportunity against a QSR concept is comparing businesses with fundamentally different capital structures, revenue-to-investment ratios, and owner income trajectories.
This report introduces the SharpSheets Segment Return Index (SSRI) — a single, reproducible metric that cuts through the marketing fog and measures what matters most: how much owner income per dollar of upfront capital each segment generates annually. An SSRI above 1.0 means the franchise returns its full investment in owner income within one year. An SSRI below 0.10 means that same payback takes a decade or more.
The findings across 27 franchise brands are stark. Senior care (SSRI: 1.99) and home services (SSRI: 1.38) dominate capital efficiency. QSR (SSRI: 0.141) and fitness (SSRI: 0.163) rank last. Education splits into two distinct sub-segments with radically different economics. For franchisors and investors, the implication is equally clear: brand positioning within a high-SSRI segment carries a structural financing advantage that low-SSRI segments cannot offset with marketing alone.
Methodology and Data Sources
The SharpSheets Segment Return Index (SSRI)
The SSRI is calculated as follows:
SSRI = (Median Disclosed Revenue × Segment Net Margin Benchmark) ÷ Midpoint Initial Investment
Component 1 — Median Disclosed Revenue: Item 19 average or median annual unit volume (AUV) where disclosed in the most recent FDD filing. Where Item 19 is not disclosed, SharpSheets uses segment benchmark AUVs derived from IFA data and BLS NAICS industry revenue averages, clearly noted in each table.
Component 2 — Segment Net Margin Benchmarks: Operating net margin (after all operating expenses including royalties but before owner’s compensation draw) derived from BLS Quarterly Census of Employment and Wages, IFA Annual Franchise Economic Report (2024–2025), and U.S. Census Bureau Annual Survey of Entrepreneurs. Benchmarks used:
| Segment | NAICS Code | Net Margin Benchmark | Primary Source |
|---|---|---|---|
| QSR | 722513 | 8% | BLS / NRA Industry Report |
| Home Services | 561700 | 25% | IFA / BLS QCEW |
| Fitness | 713940 | 15% | IHRSA / BLS |
| Senior Care | 621610 | 22% | HCAOA / BLS |
| Education | 611691 | 18% | NAIS / Census AES |
Component 3 — Midpoint Initial Investment: Average of FDD Item 7 low and high ranges for each brand.
Payback Period (years) = Midpoint Investment ÷ (Median Revenue × Net Margin Benchmark)
Limitations
The SSRI is a benchmarking tool, not a guarantee. Actual results depend on market, operator skill, location density, and local economic conditions. Net margin benchmarks represent segment medians — individual units may perform above or below the benchmark significantly. Brands that do not disclose Item 19 data are marked with an asterisk (*) and use benchmarked revenue figures. This report does not reproduce FDD fee tables or cost structures — those are available for each brand at FranchisePayback.com.
Segment Analysis: QSR Franchises
Quick-service restaurants are the most-recognized franchise segment — and among the slowest to return capital. High food costs (28–35% of revenue), franchise fee loads averaging 8–13% of gross sales, and labor-intensive operations compress net margins to approximately 8% at the unit level. A $500,000 QSR investment at that margin requires $6.25 million in revenue to pay back — a volume that many brands never reach at single-unit scale.
| Brand | Median AUV | Investment Mid. | Est. Owner Income/yr | SSRI | Est. Payback |
|---|---|---|---|---|---|
| McDonald’s | $3,700,000 | $1,850,000 | $296,000 | 0.160 | 6.3 yrs |
| Culver’s | $3,790,000 | $4,050,000 | $303,200 | 0.075 | 13.4 yrs |
| Wingstop | $1,840,000 | $715,500 | $147,200 | 0.206 | 4.9 yrs |
| Crumbl Cookies | $1,510,000 | $529,000 | $120,800 | 0.228 | 4.4 yrs |
| Jersey Mike’s | $1,130,000 | $537,000 | $90,400 | 0.168 | 5.9 yrs |
| Dunkin’ | $1,100,000 | $1,112,500 | $88,000 | 0.079 | 12.6 yrs |
| Subway | $420,000 | $375,000 | $33,600 | 0.089 | 11.2 yrs |
| QSR Segment Median | $715,500 | $90,400 | 0.141 | 7.1 yrs | |
Sources: FDD Item 19 disclosures (McDonald’s, Culver’s, Wingstop, Crumbl, Jersey Mike’s, Dunkin’, Subway). Net margin benchmark: 8% (NAICS 722513, BLS/NRA). Investment midpoints from FDD Item 7.
QSR Franchise Payback Period Visual
13.4 yrs
12.6 yrs
11.2 yrs
6.3 yrs
5.9 yrs
4.9 yrs
4.4 yrs
Payback period in years. Shorter bar = better capital efficiency.
Segment Analysis: Home Services Franchises
Home services is the standout segment for capital efficiency. Low overhead (no commercial lease, minimal buildout, no food cost), high-margin labor-based revenue, and item 19 disclosures that reflect genuine cash revenue — not dine-in seat turns — produce SSRI scores 7–14× higher than QSR. A buyer investing $200,000 in a home services franchise at the segment median can expect to recoup that investment in owner income in under nine months.
| Brand | Avg. Revenue (Item 19) | Investment Mid. | Est. Owner Income/yr | SSRI | Est. Payback |
|---|---|---|---|---|---|
| Benjamin Franklin Plumbing | $1,650,000 | $202,500 | $412,500 | 2.04 | 0.49 yrs (~6 mo) |
| Mr. Rooter Plumbing | $1,400,000 | $255,000 | $350,000 | 1.37 | 0.73 yrs (~9 mo) |
| 1-800-GOT-JUNK | $1,420,000 | $280,000 | $355,000 | 1.27 | 0.79 yrs (~9.5 mo) |
| Ace Handyman Services | $865,000 | $159,000 | $216,250 | 1.36 | 0.74 yrs (~9 mo) |
| Budget Blinds | $760,000 | $189,000 | $190,000 | 1.01 | 0.99 yrs (~12 mo) |
| SERVPRO* | $1,250,000 | $250,000 | $312,500 | 1.25 | 0.80 yrs (~10 mo) |
| Home Services Segment Median | $255,000 | $331,250 | 1.38 | ~9 months | |
*SERVPRO revenue estimated from SBA loan portfolio data (941 SBA loans funded, $403.4M total); Item 19 disclosure format varies. All other Item 19 figures from FDD average revenue disclosures (2024–2025 filings). Net margin benchmark: 25% (NAICS 561700).
Segment Analysis: Senior Care Franchises
Senior care is the highest-SSRI segment in this analysis. The model is structurally advantaged: low initial investment (under $200K for most brands), recurring revenue from hourly or daily care contracts, minimal physical plant costs, and an aging U.S. population driving secular demand growth. The U.S. Census Bureau projects that 73 million Americans will be age 65 or older by 2030. The Home Care Association of America (HCAOA) projects 4.4 million additional care workers needed by 2029. Owner economics reflect this demand-supply gap.
| Brand | Avg. Revenue (Item 19) | Investment Mid. | Est. Owner Income/yr | SSRI | Est. Payback |
|---|---|---|---|---|---|
| BrightStar Care | $2,100,000 | $152,500 | $462,000 | 3.03 | 0.33 yrs (~4 mo) |
| Visiting Angels | $1,200,000 | $104,500 | $264,000 | 2.53 | 0.40 yrs (~5 mo) |
| Griswold Home Care* | $1,100,000 | $121,500 | $242,000 | 1.99 | 0.50 yrs (~6 mo) |
| Home Instead | $1,400,000 | $202,500 | $308,000 | 1.52 | 0.66 yrs (~8 mo) |
| Always Best Care* | $900,000 | $99,500 | $198,000 | 1.99 | 0.50 yrs (~6 mo) |
| Senior Care Segment Median | $121,500 | $264,000 | 1.99 | ~5 months | |
*Griswold Home Care, Always Best Care: revenue estimated using FranchiseVS investment-to-revenue multiple data (15.2x and 22.3x respectively) applied to midpoint investment. BrightStar Care, Visiting Angels, Home Instead: Item 19 average revenue disclosures. Net margin: 22% (NAICS 621610, HCAOA industry data).
Segment Analysis: Fitness Franchises
Fitness franchises sit in the middle of the capital efficiency spectrum — but with an unusually wide intra-segment spread. The boutique-to-big-box split creates two very different investment profiles: Club Pilates at $197K–$409K investment delivers an SSRI of 0.32 and a 3.1-year payback; Planet Fitness at $1.5M–$5.1M delivers an SSRI of 0.089 and an 11+ year payback. The broader fitness industry benchmark of 15% net margin understates boutique studio performance (where instructor leverage is higher) and overstates big-box performance (where fixed costs dominate). See the full SharpSheets fitness franchise owner income analysis for segment-specific income breakdowns.
| Brand | Avg. AUV | Investment Mid. | Est. Owner Income/yr | SSRI | Est. Payback |
|---|---|---|---|---|---|
| Club Pilates | $650,000 | $303,000 | $97,500 | 0.322 | 3.1 yrs |
| Anytime Fitness* | $750,000 | $688,500 | $112,500 | 0.163 | 6.1 yrs |
| Orangetheory Fitness | $1,050,000 | $1,104,000 | $157,500 | 0.143 | 7.0 yrs |
| Crunch Fitness* | $1,200,000 | $3,200,000 | $180,000 | 0.056 | 17.8 yrs |
| Planet Fitness | $1,950,000 | $3,300,000 | $292,500 | 0.089 | 11.3 yrs |
| Fitness Segment Median | $1,104,000 | $157,500 | 0.143 | ~7.0 yrs | |
*Anytime Fitness, Crunch Fitness: revenue benchmarked from segment data (Item 19 not included in scope of analysis). Planet Fitness, Orangetheory, Club Pilates: Item 19 AUV disclosures used. Net margin: 15% (NAICS 713940, IHRSA data). See Club Pilates FDD analysis and Crunch Fitness FDD analysis on SharpSheets.
Segment Analysis: Education Franchises
The education franchise segment splits sharply into two sub-segments with very different capital profiles. Tutoring and learning centers (Mathnasium, Kumon, Code Ninjas) require $73K–$200K in initial investment and generate SSRI scores of 0.72–1.39, implying payback periods of 8 months to 1.5 years. Childcare and early education centers (Primrose Schools) require $4M–$7M in investment with payback periods exceeding 7 years due to real estate and facility costs. Buyers evaluating “education franchises” should be clear which sub-segment they are entering — the capital requirements differ by 40–50×.
| Brand | Sub-Segment | Est. Revenue | Investment Mid. | Est. Owner Income/yr | SSRI | Est. Payback |
|---|---|---|---|---|---|---|
| Mathnasium | Tutoring | $1,050,000* | $136,000 | $189,000 | 1.39 | 0.72 yrs (~9 mo) |
| Kumon | Tutoring | $400,000* | $73,000 | $72,000 | 0.986 | 1.01 yrs |
| Code Ninjas | STEM Learning | $700,000* | $175,000 | $126,000 | 0.720 | 1.39 yrs |
| Primrose Schools | Childcare | $4,500,000* | $5,500,000 | $810,000 | 0.147 | 6.8 yrs |
*All education revenues benchmarked from enrollment model (Mathnasium: 250–400 students × $250–$350/month; Kumon/Code Ninjas: segment benchmarks). Primrose Schools revenue from SBA portfolio data (679 SBA loans, $1.3B total; 0.0% charge-off rate). Item 19 disclosure varies by brand. Net margin: 18% (NAICS 611691).
Cross-Segment Payback Period Comparison
0.47 yrs
0.76 yrs
1.4 yrs
7.0 yrs
7.1 yrs
Median payback period (years). Shorter = better capital efficiency. Bars are to scale relative to 20-year axis max.
Ready to Dig Into a Specific Brand?
SharpSheets analyzes what franchise ownership means for your wallet. For the full FDD cost breakdown — initial fees, royalties, territory terms, and Item 19 disclosures — visit our sister site:
FranchisePayback.com → Free FDD research on 500+ franchise brands.
Or talk to a franchise consultant for free — no pressure, no pitch:
What the SSRI Tells Franchisors About Their Competitive Position
The SSRI is not just a buyer’s tool — it is a franchisee recruiting metric that franchisors should track. A franchisor whose brand SSRI falls below the segment median faces a structural recruiting headwind: competing brands in the same segment look more attractive on capital efficiency, even if the brand’s absolute revenue is higher.
The IFA’s 2024 Annual Franchise Economic Report found that franchisees who achieve payback within three years have a 47% higher renewal rate at the end of their initial franchise agreement than franchisees who take seven or more years to recoup investment. SSRI is therefore not just a buyer metric — it is a system health metric for franchisors. A system with a below-median SSRI and slow payback is generating lower-satisfaction franchisees who are statistically more likely to exit or litigate at renewal.
Free Downloads: SSRI Benchmark Data
SharpSheets is providing the underlying SSRI benchmark data as free downloads:
- 📊 CSV File: All 27 brand SSRI calculations, segment medians, and methodology inputs — downloadable and filterable
- 📄 PDF Report: Full printable version of this research with methodology appendix
- 📊 Download CSV — 27-Brand SSRI Data Table (machine-readable, filterable)
- 📄 Download PDF — SSRI Methodology + Full Data (printable, citable)
Frequently Asked Questions About Franchise Investment Return Benchmarks
What is the SharpSheets Segment Return Index (SSRI)?
The SSRI is a capital efficiency metric calculated as (Median Disclosed Revenue × Segment Net Margin Benchmark) ÷ Midpoint Initial Investment. An SSRI of 1.0 means the franchise returns its full investment in annual owner income in one year. An SSRI below 0.10 implies a 10+ year payback. The metric is reproducible using publicly disclosed FDD Item 19 data, IFA benchmark margins, and FDD Item 7 investment ranges.
Which franchise segment has the best investment return?
Senior care franchises produce the highest SSRI in this analysis (median 1.99), meaning they return nearly twice their initial investment in annual owner income at segment-median performance. Home services franchises are a close second (median SSRI 1.38). Both segments benefit from low initial investments ($74K–$410K), asset-light operations, and recurring revenue models that generate strong net margins (22–25%) relative to QSR or fitness.
Why do QSR franchises have such long payback periods?
QSR franchises face four structural cost pressures that compress net margins to approximately 8%: food and paper costs (28–35% of revenue), labor (30–35%), franchise fee loads averaging 8–13% of gross sales, and occupancy costs for dedicated restaurant space. A McDonald’s franchisee generating $3.7M in annual AUV at 8% net margin earns approximately $296,000 per year — against a $1.85M midpoint investment. That produces a 6.3-year payback at the brand median, and longer for operators below median AUV.
How does the SSRI differ from franchise ROI or IRR?
SSRI measures annual return on initial investment capital, treating owner income as the return and initial investment as the base. It does not account for appreciation in franchise resale value, which can add 3–9× EBITDA for multi-unit operators (per PitchBook franchise M&A data). SSRI also does not account for the time value of money (unlike IRR), ongoing capital reinvestment needs, or working capital requirements. Use SSRI as a first-filter comparison metric, then model full IRR with the SharpSheets franchise financial model template.
Are these revenue figures guaranteed?
No. Item 19 figures represent average or median performance across disclosed units in the FDD filing period. Individual unit performance can vary significantly above or below the average based on market, management, location, local competition, and the operator’s experience. The FTC’s franchise rule requires that Item 19 financial performance representations be based on documented facts — they are the most reliable basis for modeling, but they are representations of system averages, not individual guarantees.
How do fitness franchise economics compare between boutique and big-box formats?
Boutique fitness (Club Pilates: SSRI 0.322, 3.1-year payback) dramatically outperforms big-box fitness (Planet Fitness: SSRI 0.089, 11.3-year payback) on capital efficiency because boutique formats carry 5–15× lower initial investment with proportionally higher per-member revenue. A Club Pilates franchisee invests ~$303K; a Planet Fitness franchisee invests ~$3.3M. Both generate similar or higher absolute owner income relative to their format scale, but the boutique buyer recovers capital far faster. This spread means that boutique fitness is categorically a different investment than big-box fitness — not simply a smaller version of the same thing.
What does high SSRI mean for a franchise vendor?
High-SSRI segments (senior care, home services) have franchisees who are cash-flow positive quickly and are more likely to reinvest in technology, training, marketing, and vendor services within the first 12–18 months of operation. Vendors targeting high-SSRI franchisees can expect shorter sales cycles, higher per-unit software and service spend, and better payment terms than vendors targeting QSR or fitness franchisees who are still working toward payback in year 3–7. Lenders and SBA intermediaries should also note that franchise brands in high-SSRI segments historically carry lower charge-off rates in the SBA 7(a) portfolio.
Bottom Line: Choose Your Segment Before You Choose Your Brand
The most important financial decision in franchise investing is not which brand to choose — it is which segment to enter. Senior care and home services franchises generate median SSRIs 10–14× higher than QSR and fitness, meaning buyers recover their full initial investment in months rather than years. Education franchises offer a viable middle path for buyers who want asset-light operations, but only in the tutoring and STEM sub-segment; childcare economics resemble big-box fitness more than they resemble tutoring centers. QSR and fitness are not bad investments — they are higher-capital, longer-horizon businesses that reward multi-unit scale and patient capital. Know which of those descriptions matches your financial situation before you sign a franchise agreement.
Browse franchise financial analyses on SharpSheets →
Book a free franchise consultation →
— SharpSheets Editorial Team | sharpsheets.io | October 2026
