How To Use The Hardware SaaS (HaaS) Financial Model Template
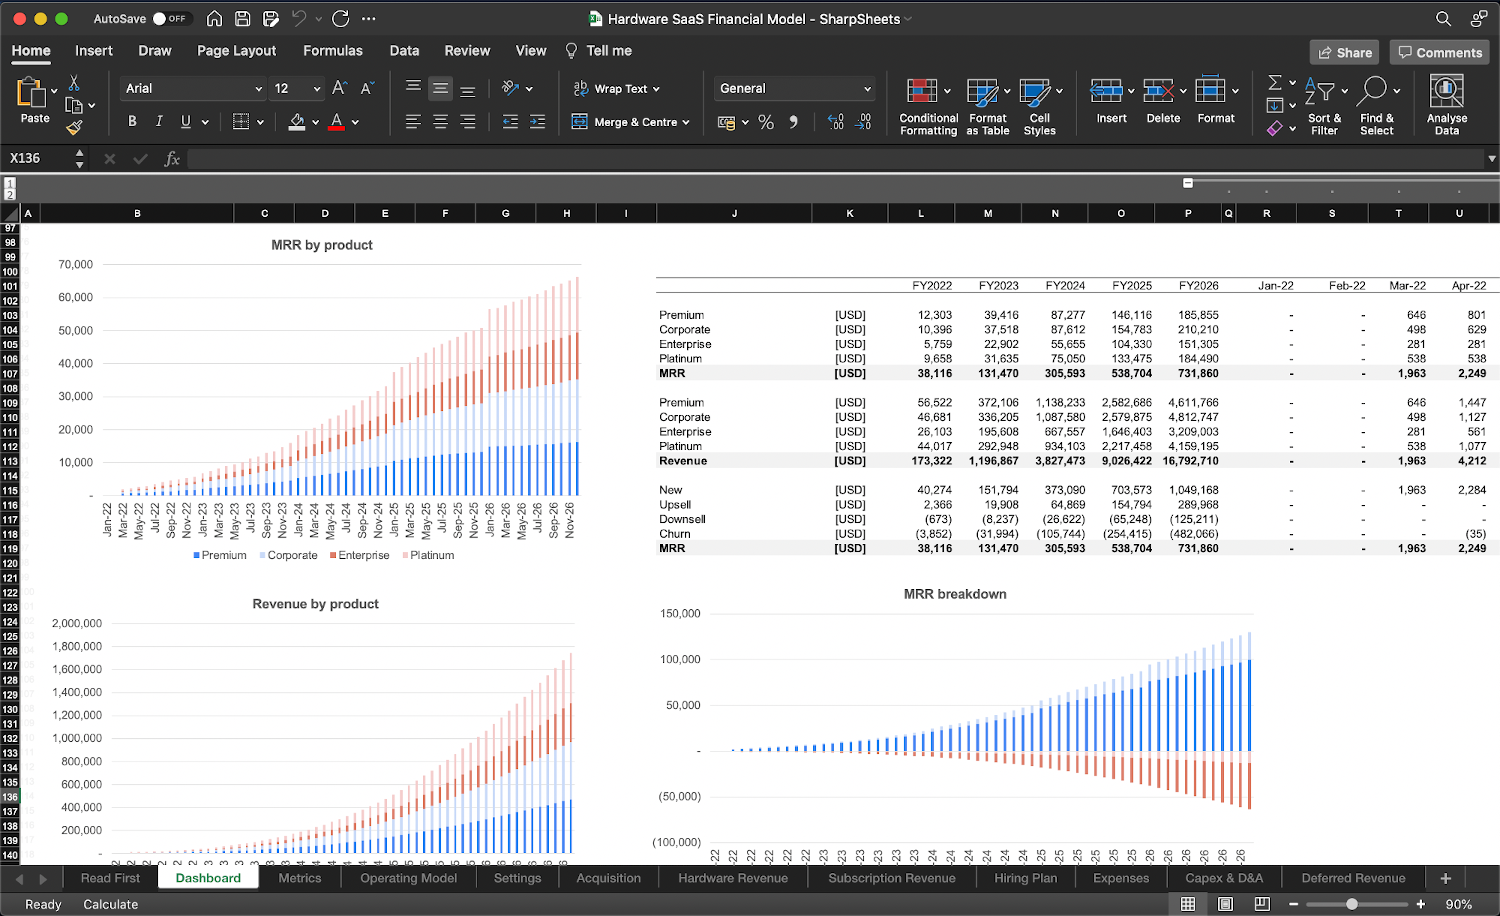
Disclaimer: this article is for anyone who downloads our Hardware SaaS financial model template and need a step-by-step guide on how to use it.
If you haven’t yet downloaded our Hardware SaaS (HaaS) financial model, do so here:


Hardware SaaS financial model
Download an expert-built 5-year Excel financial model for your pitch deck
Hardware SaaS financial model
Download an expert-built 5-year Excel financial model for your pitch deck
Before we dive in the step-by-step guide, note that we are using for the purpose of this article the Google Sheets version. You can of course download the template use it with Excel instead.
Let’s dive in!
Step 1: Settings
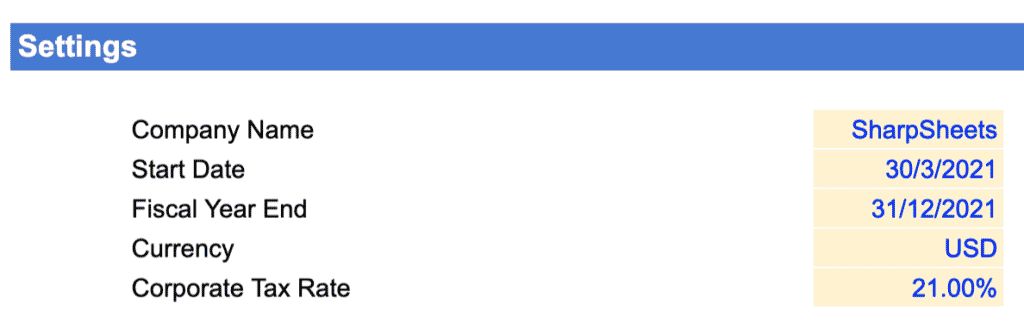
The first thing we need to do is to enter a few details in the Settings tab. They are in order:
- Company name: the name of your business / project
- Start date: the first month the model will forecast from. Note that the first month should be in the future, and it isn’t necessarily the following month. For instance, assuming we are today in July 2021, and you are raising capital which you expect to last 2 months, the start date can very well be September 2021 or even later.
- Fiscal year end: by definition, this is the date that defines the end of a 12-month period for accounting purposes. In our templates, this date is important as it will serve to calculate the annual summaries of your P&L, balance sheet and cash flow statement. Note that most businesses have 31st December as fiscal year end. When in doubt, ask your accountant.
Note: the year in the fiscal year end is not relevant. For instance, if your fiscal year ends on December 31st, 31/12/2021 and 31/12/2022 are exactly the same thing.
- Currency: the main currency of your business and in which you want to present your financials. Note that the currency does not impact any calculation: it is simply used as a legend throughout the model.
Note: if your business operates in different currencies, use the same currency throughout for your model. For instance, assuming you sell your products in USD but have some staff paid in EUR and your reporting currency is USD. In this case, the expenses (the salaries of the staff in EUR) should be converted in their USD equivalent when you enter your hiring plan (more on that below)
- Corporate tax rate: this is the tax rate you pay in your jurisdiction. If you aren’t sure which is yours, refer to KPMG’s exhaustive updated list here.
Step 2: Acquisition
In the same Settings tab, we will now enter key assumptions affecting your acquisition: how to “acquire” new leads. This is where we forecast the number of new users (or customers) you acquire over time.
2.1. Choose your acquisition model

The template allows you to choose from 2 types of acquisition depending on your business model:
- Outbound acquisition: the number of new customers is a function of the number of sales representatives. In other words, you generate growth from your sales team. This is more relevant for B2B SaaS businesses.
- Inbound acquisition: new customers are a function of the number of visitors who land on your website. The visitors are either from paid (paid ads) or organic sources.
Note: if you acquire through B2B sales reps but also generates traffic on your landing page (the leads at the top of the funnel are from inbound acquisition but your sales people convert them down to customers via inbound acquisition), select Inbound acquisition. Indeed, whilst the number of customers will be a function of the number of sales reps you have, you will still be able to factor in paid marketing expenses and forecast the number of paid and organic visitors separately (see below)
2.2. Outbound (Sales Reps)

If you choose “Outbound” as acquisition strategy earlier, you will need to enter here the efficiency of your sales reps over time. Because not sales typically aren’t fully operational day 1, but improve their performance over time, the template gives you this flexibility. This is very common for B2B and more Enterprise SaaS businesses to forecast growth in such a way.
- Closing per Sales Rep per month: enter the number of customers one Sales representative close, in average, depending on her/his seniority. For instance, in our example one Sales representative close in average her/his first client 4 months after joining the company. It’s only after 10 months post hire that they are fully operational and close 3 customers per month
Note: whilst we enter the efficiency of your sales team here, it is in the Hiring plan where you will enter the number of sales representatives you hire over time (more on that later)
2.3. Paid traffic
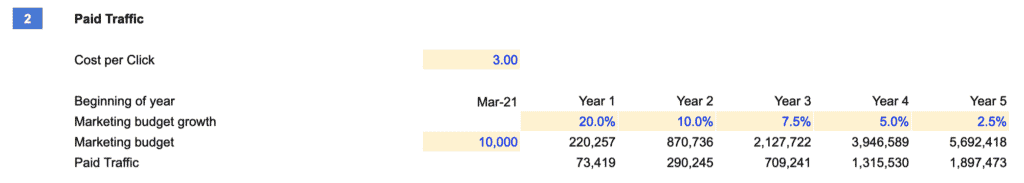
Whether you are generating growth (i.e. customers) via inbound or outbound acquisition, you need to enter some assumptions behind your paid acquisition (if any). Paid traffic is by definition the number of visitors who land on your website via paid ads (Google Ads, social media, etc.).
It is all the more important if your acquisition is inbound because the number of customers you “acquire” simply is:
Number of new customers = Number of visitors x conversion rate
Whilst we will set your conversion rate later on, it is paramount to estimate correctly the number of paid visitors. The simple formula is:
Number of paid visitors = Paid marketing budget / average cost-per-click
Calculating paid marketing budget
Therefore we need to set 3 assumptions here:
- The average cost-per-click of all your campaigns. If you are running search and social media ads for instance, enter the average CPC. For more information about cost-per-click benchmarks per industry, have a look at our article here.
- The first month of your marketing budget spending. By default, the first month is the date of the launch of your first subscription. The amount is the monthly budget you expect to spend in that month.
Example: Let’s assume you start your model in September 2021, and expect a 6 month product development during which you will not generate any revenues. You would set the launch of your first subscription in February 2022, and from this date onwards you would start to spend money in paid marketing to acquire paid traffic.
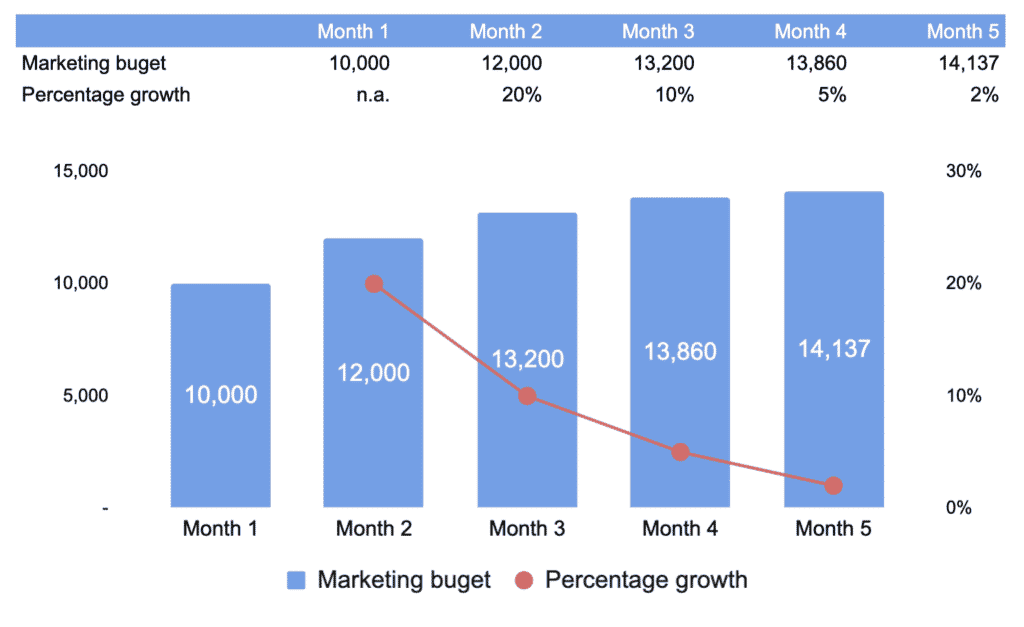
- The monthly growth of your marketing budget. This is a tricky one: you marketing budget will change over time (likely it will increase) from the first month you just set. As such, you will spend more in the future, and we need to estimate the amount of monthly marketing budget you will spend over time. This monthly marketing budget is calculated using a monthly percentage growth. Yet, because the monthly budgets will increase over time, the percentages themselves will decrease. In other words, you are still increasing your marketing budget over time, yet the positive percentage growth decreases. See below an illustration to make it clearer.
Note: the percentages are set at the beginning of each year. In our example above, monthly growth starts at 20% in the beginning of the first year, and decreases progressively down to 10% at the beginning of year 2, and so on.
2.4. Organic traffic
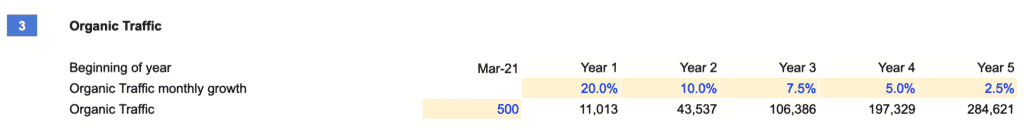
This is the number of visitors you generate organically (unlike paid traffic for which you pay per click, or impressions). It works in a similar fashion as paid traffic. The only difference is that we do not have to set a cost-per-click. Therefore the assumptions to set are:
- First month organic traffic. The number of visitors you expect to generate in the first month (again, the date of the launch of your first subscription) from organic sources
- Organic traffic monthly growth. The same way marketing budget increases thanks to a percentage growth, organic traffic will do so too. Refer to paid traffic above for a refresher on how this works.
Step 3: Conversions
In the same Settings tab, we will now enter assumptions behind conversions: how to “convert” new leads into customers.
IMPORTANT: note that if you choose an outbound acquisition strategy, this step is irrelevant. Indeed, with an outbound customer acquisition, the number of customers you acquire is instead a direct function of the number of Sales representatives and their efficiency (see 2.2. Outbound (Sales Reps) above). Also note that, even if with you acquire customers from an outbound customer acquisition strategy (with Sales reps), you can still forecast the number of visitor traffic (paid and organic). Indeed, the customers your Sales reps acquire might, for example, be visitors landing on your website at the top of the acquisition funnel. Yet, in that case, whilst we forecast the number of visitors, the number of customers themselves is a function of the Sales reps, and not the visitors (and the conversion rates below are irrelevant).

The template allows you to differentiate, over time, the conversion rates for Organic and Paid visitors. Indeed, usually organic conversion rates are significantly lower vs. paid visitor traffic conversion rates.
Step 4: Subscription Revenue
In the same Settings tab, we will now enter key assumptions affecting your subscription revenue.
Remember, you’re selling hardware to your customers in the form of subscriptions (“hardware-as-a-service”). So we will focus first on your subscription revenue, and then look at the hardware component in the following section.
The assumptions are:
4.1 Subscription tiers
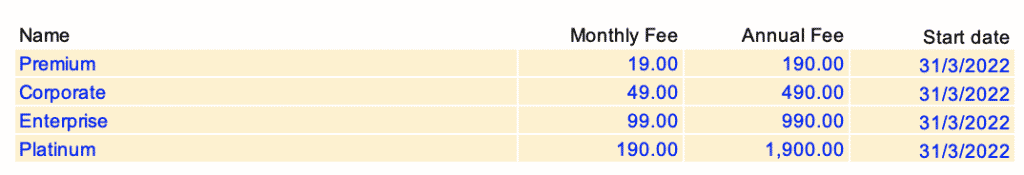
- The name of your subscription tiers: the model allows you to have up to 4 subscriptions (including a free plan if you need to). The names you enter will flow through the Revenue and Operating Model sheets of the template
- Pricing: enter the monthly and annual fee of your subscriptions. If your plan does not include one or the other, simply enter zero. Annual subscriptions typically are discounted vs. monthly billings, so the template gives you this ability.
Note: the annual fee is per year. In the example above, the price of the “Premium” plan is $19.9 per month (so $238.8 per year), or $190 per year if billed yearly.
- Start date: this is the date from which the subscription is launched. For instance, you might not launch all subscriptions at the same time, instead you might launch some later in the future. In the example above, all subscriptions are launched in March 2021.
Note: start date cannot be prior the model Start date.
4.2 New users distribution
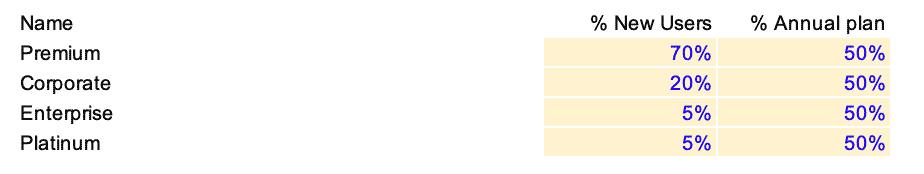
This is where we decide which new user choose which plan.
Note: This is only valid for new users (the leads who converted and became customers). Indeed, existing customers will have the ability to move between the subscription tiers via upsell and downsell (more on that below).
For each of the subscription tiers, you will need to enter:
- The breakdown of new users per tier: in our example, if you convert 100 new customers in a month, 70 will choose “Premium”, 20% “Corporate”, 5% “Enterprise” and the remaining 5% the “Platinum” plan.
Notes:
- The sum of all percentages need to be 100%
- If you have less than 4 tiers (for instance 2) enter 0% for the relevant tiers.
- The breakdown of new users is calculated in the Revenue tab. Because the users are rounded, if the number of new users is too low the percentage might round up or down the value. For instance, assuming you convert 10 new users in a month, because we can’t have 0.5 customers choosing Enterprise and Platinum respectively, the model will round Enterprise to 1 and Platinum to 0
- If you entered different start dates in the Subscription Tiers section, the breakdown will take it into account. Let’s assume you have 2 tiers and you launch the 2nd six month after the 1st, and you enter 50/50% for the new users breakdown. The model will attribute 100% of new users to plan 1 for the first 6 months, and 50/50% from month 7 onwards.
- The breakdown of new users per billing cycle: choose which percentage, for each tier, of new users who choose to pay annual vs. monthly.
4.3 Upsell and Downsell
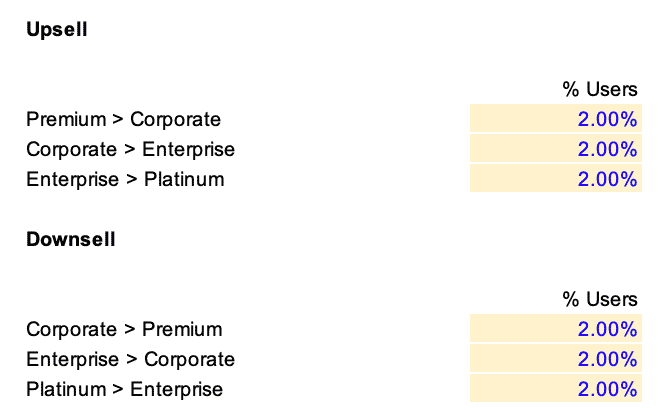
By upsell and downsell, we allow customer movements between the different tiers after they have converted as customers for the first time.
For each plan, you will need to enter a percentage. This is the percentage of a plan’s total users that move to the nearest plan (either up for upsell, or down for downsell). For instance, in our example above, every month, you expect 2% of the “Premium” plan to move (or “upsell”) to the “Corporate” plan.
Downsell is simply the inverse of upsell.
Note: remember these values are monthly. THerefore, if you enter 20% it means that every month, 20% of a given tier will upsell or downsell to another plan. If you expect, say, a 20% upsell rate from plan A to B, simply use 20%/12 for the monthly upsell equivalent.
4.4: Churn
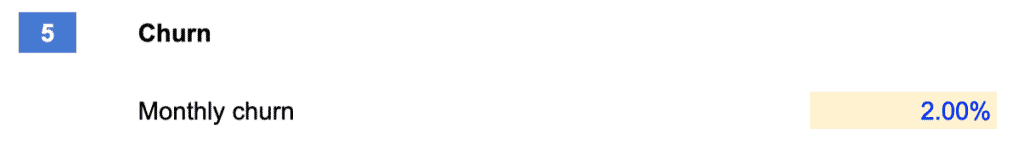
Here you need to enter the percentage of monthly churn to calculate the number of users, each month, who cancel their plan and leave. Note this is across all subscription tiers.
Note: like upsell and downsell rates, churn is a monthly percentage. As such if you expect 20% annual churn, enter 20%/12 for the monthly churn instead.
Step 5: Hardware Revenue
Now that we have dealt with Subscription Revenue, we will not look into the revenue your business generates from the actual sale of hardware (if any).
5.1. Hardware Revenue
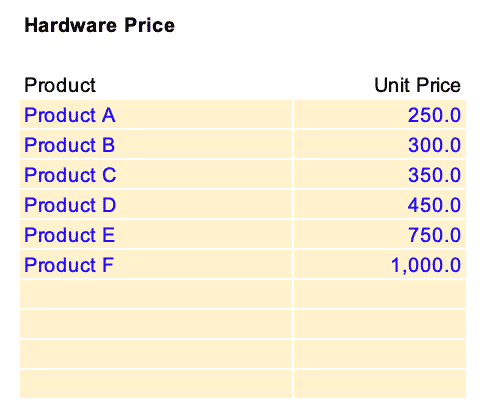
The template allows you to differentiate up to 10 different hardware categories. Assuming you have more, please segment the hardware into these 10 categories instead.
- Product: name of the hardware item (or the hardware category) you are selling to customers
- Unit Price: the price you are charging customers as a one-time fee in addition to the subscription fee
IMPORTANT: if you do not charge your customers for the sale of the hardware and instead include it in their subscription fee, leave 0 as unit price.
5.2. Sales Mix
As soon as you acquire a new customer, this customer will fall into one of the 4 subscription tiers we have seen earlier (see 4.2 New users distribution).
In addition to choosing a subscription tier (or “subscription plan”), the customer will also choose a hardware product. This is what we are focusing on here.
If your business has a rather simple breakdown (for example you have 2 subscriptions that each give right to a single hardware product), you can of course reflect here the same distribution as for 4.2 New users distribution.
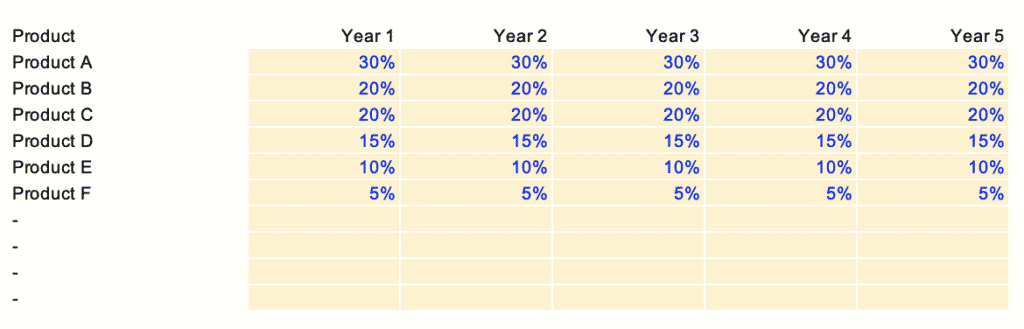
Note: the sum of all percentages per year need to be 100%
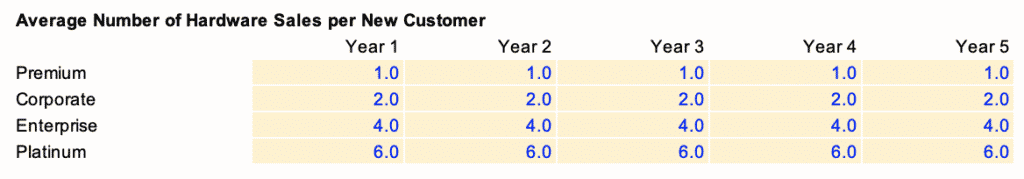
5.3. Average Number of Hardware Sales per New Customer
You might sell multiple hardware products per customer (for example think about a security hardware company that sells cameras and such to corporate clients e.g. offices, factories, etc.).
This is where you can enter the number of hardware products you actually sell per customer, for each subscription tier.
5.4. Retention
Some Hardware SaaS businesses have a retention component, meaning they sell multiple times to repeat customers. This can happen for 2 reasons usually:
- Customers grow in scale over time: in our security hardware company example earlier, their clients may purchase more hardware products over time as they open more offices for example
- The hardware needs to be replaced (and you charge for this)

Therefore, if your business has a retention component to it, you will need to enter the following assumptions:
- Average % of New Customers who purchase again: the percentage of the new customers you onboard who will purchase again (at least once) in the future. Indeed, all your customers might not be repeat customers but a small portion only
- Purchase Frequency (every X year): the number of years between each purchase (for example, if a repeat customers buys 2x a year in average, leave 0.5)
- Average Hardware Sales per Repeat Customer: the number of hardware products that get purchased for each repeat order
Step 6: Hiring Plan
Now that we have dealt with revenues, let’s have a look at your expenses, starting with payroll. Indeed, one of the biggest expense category of Hardware SaaS business often is salaries. It is therefore very important to set up your future roles and their related expenses (salaries, bonuses) correctly.
6.1. Teams
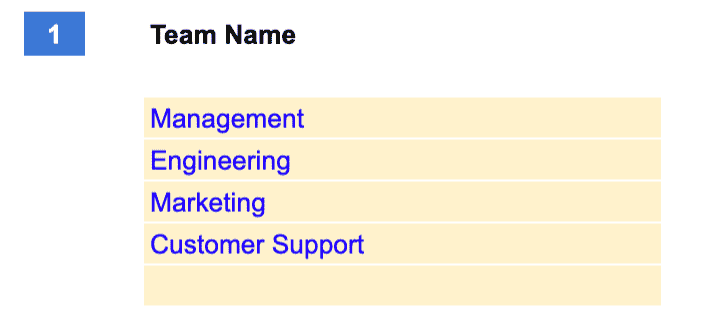
The first thing we need to do is to list the different teams you have and group them into up to 5 categories. This will allow us to differentiate salaries into the different teams in your P&L and your metrics later on.
Note: if you selected outbound acquisition under Acquisition (section 3 above) earlier you will need to enter at least a “Sales” team so the template can calculate correctly the number of Sales people that generate customers in the Acquisition sheet.
6.2. Roles
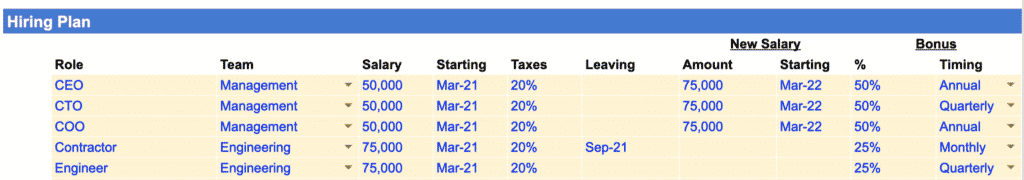
In the Hiring Plan sheet, you will need to enter all the roles you expect to hire in the future. For each, you will need to enter (as shown in the table above), in order:
- Role: either the role or the name of the recruit
- Team: drop-down list to select the name of the team the role falls into (the teams are the ones we set up earlier)
- Salary: the annual gross salary
- Starting: the date when you expect to hire the role.
Note: if you already have existing roles before the start of the model, enter the date in the future you recruited the role. For instance, if you are CEO and started to work since January 2021 but the first date you project your financials from is September 2021, enter January 2021 as the starting date for CEO.
- Taxes: any taxes and benefits you incur on top of salary, expressed as a percentage of gross annual salary
- Leaving. If you have contractors with fixed term employment contracts for instance, enter the date at which you will not employ that role anymore
- New salary amount. If you expect to increases salaries in the future of certain roles, enter the new annual gross salary here
- New salary starting date: the date you start to pay the new salary
- Bonus %. If you pay bonuses on top of salary to certain roles, enter the corresponding percentage of annual gross salary you pay each year as a cash bonus.
- Bonus timing. Here you can set whether you pay bonuses every month, quarter or yearly.
Step 7: Expenses
In the Settings sheet you can enter a number of assumptions for the template to calculate automatically the expense amounts in Expenses.
7.1. Hardware COGS
This is probably, with Salaries, the most important expense category of your business.
Indeed, whether you charge customers for the sale of hardware in addition to the subscription fees or not, as a Hardware SaaS business you must pay for the cost to purchase, or manufacture the hardware itself. This is where we enter the relevant Cost of Goods Sold (COGS) for each hardware product.
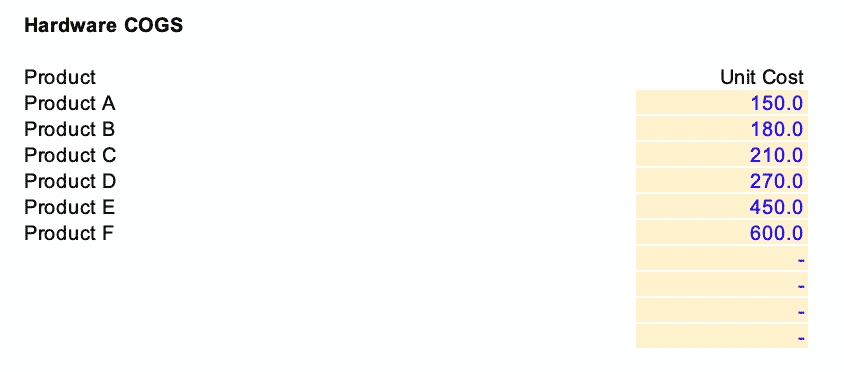
- Unit Cost: the total cost you incur per hardware product to source and/or manufacture the hardware product. Also, note that if you incur any other costs related to the sale of the hardware (e.g. delivery costs), do include these costs as well in there
7.2. Payment processing fees
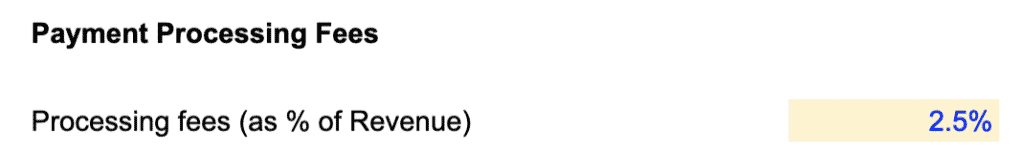
Enter the percentage of revenues you will pay to your payment processing provider (e.g. Stripe, Paypal, etc.)
7.3. Customer Support
Customer support is an important expense category for most Hardware SaaS businesses. The template gives you the ability to forecast Customer Support in 2 different ways, either:
- Enter the customer support roles one by one in the Hiring Plan as shown above; or
- Forecast customer support salaries as a function of the number of users you have
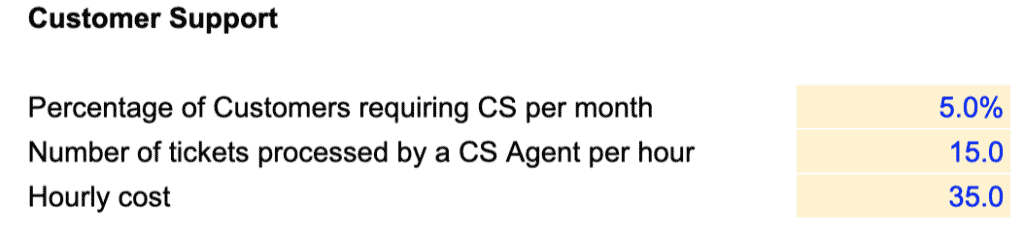
We are covering here the 2nd approach. Customer support salaries will be calculated by taking into account 3 different assumptions which you will need to set:
- Percentage of customers requiring customer support per month. Let’s assume you have 1,000 active customers in a month, not all might contact your customer support service. For instance, if a customer calls your CS say, every 2 months, enter 50% (indeed, 50% of all active customers contact CS every month, ie every 2 months)
- Number of tickets processed by a customer support agent per hour. Here we set the “efficiency” of your customer support team. If you are dealing with B2B clients, the tickets may take more time to be processed (hence an agent might only process a handful per hour). In comparison, if your tickets are usually dealt via email within a few minutes (e.g. B2C) enter a higher number here
- Hourly cost of a customer support agent. This is the total hourly cost you pay your customer support agents (including taxes and benefits, if any)
Note: If customer support is outsourced to a 3rd party instead (to Teleperformance for instance), simply enter here the hourly cost you pay per customer agent.
7.4. Hosting
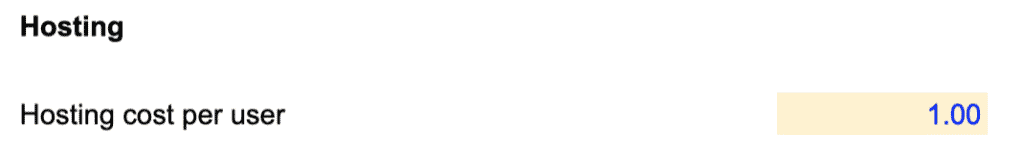
Enter here the amount you spend per month per customer in hosting, tech infrastructure, etc.
7.5. Team expenses
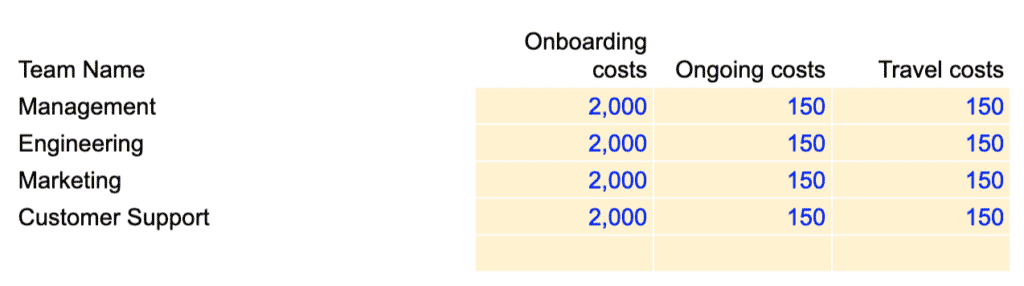
For each team, you have the ability to set a spending per role, it includes:
- Onboarding costs: any one-off you incur when you hire a role (computer, desk, etc.)
- Ongoing costs: any recurring expenses you incur per month per role (subscription, meal allowances, etc.)
- Travel: the travel allowance per role per month. Management and sales team may travel more than the engineering team for instance, so you can differentiate them here.
7.6. Other expenses
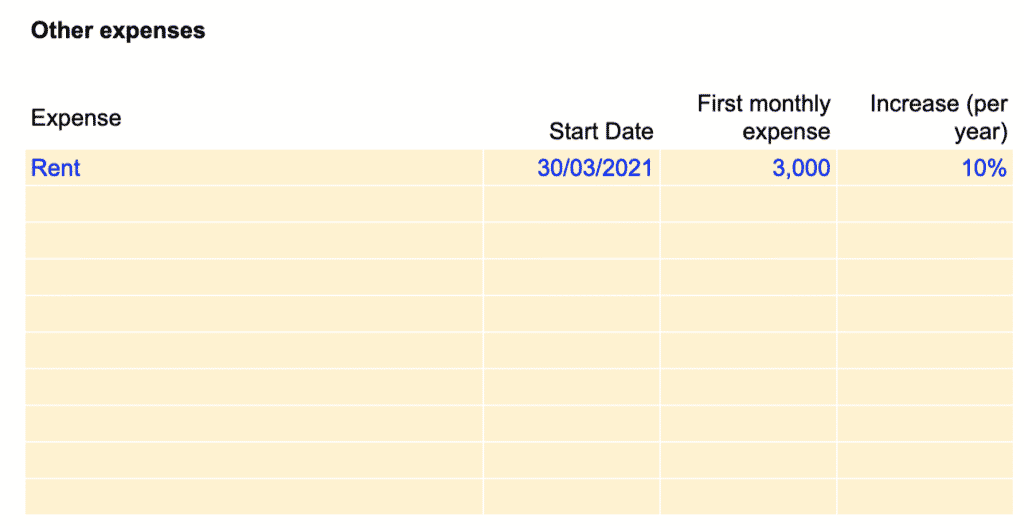
Enter here any other recurring expenses you haven’t included yet. For each expense there are 4 assumptions to set:
- Expense: the name of the expense
- Start date: the date from which you start to incur such expense
- First monthly expense: the amount of the first month
- Increase (per year): the percentage increase (per year) at which the expense grows over time (if it does)
Note: if the expense stays flat over time, leave percentage increase to zero instead.
Step 8: Balance sheet
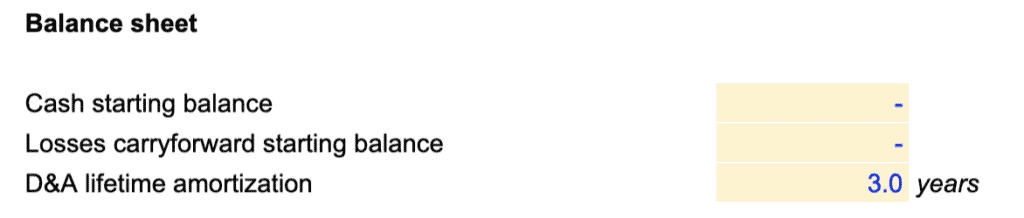
- Cash starting balance: the amount of cash you already have in the bank before the start of the model
Note: do not include the fundraising round (see below) you expect to raise here. It will be added automatically to your cash balance.
- Losses carry-forward starting balance. If you have any tax credit from your state, enter the amount here. For a refresher on what losses carry-forward, see Investopedia’s definition here.
- D&A lifetime amortisation. Any capex you will spend in the future (see below) will be depreciated over time. This is where you select the depreciation schedule. If in doubt, ask your accountant.
Step 9: Capex
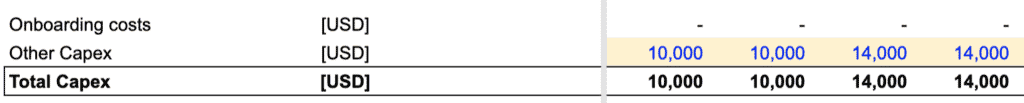
If you expect to spend any capital expenditure in the future (building, equipment, etc.) or simply capitalise part of your expenses, enter the amount under “Other capex” in the Capex & D&A sheet.
Notes:
- By default the template already includes onboarding costs (see team expenses) within capex. Indeed, onboarding costs such as computers and desks are assets and need to be included within capex and depreciated over time
- Costs incurred to manufacture the hardware products should be included in Hardware COGS instead (see 7.1. Hardware COGS)
Step 10: Fundraising
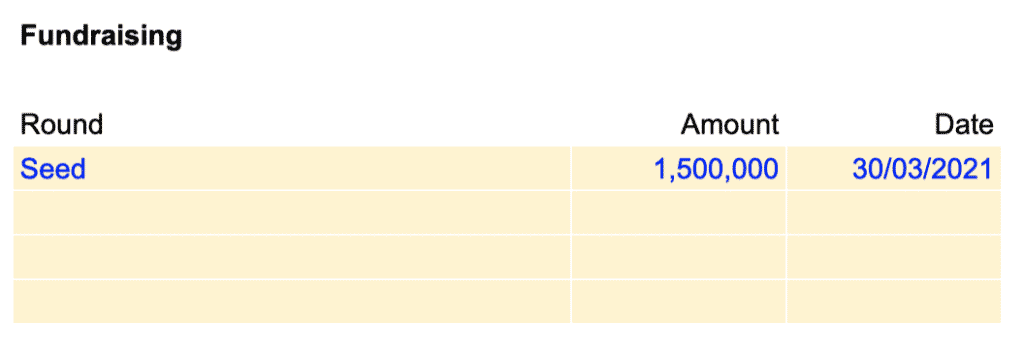
This is where you can set the fundraising rounds you expect in the future. Set here 3 assumptions:
- Round: name of the round (e.g. Seed, Series A, etc.)
- Amount: the amount you expect to raise from this round
- Date: the date of the round
Hardware SaaS financial model
Download an expert-built 5-year Excel financial model for your pitch deck
Hardware SaaS financial model
Download an expert-built 5-year Excel financial model for your pitch deck