How To Use Our Ecommerce Financial Model Template (+ Free Preview)
Disclaimer: this article is for anyone who downloads our Ecommerce financial model template and need a step-by-step guide on how to use it. We remind you that our template also comes with a 1 hour onboarding video as well.

Ecommerce Financial Model Template
Download an expert-built 5-year Excel financial model for your pitch deck
Ecommerce Financial Model Template
Download an expert-built 5-year Excel financial model for your pitch deck
Before we dive in the step-by-step guide, note that we are using for the purpose of this article the Google Sheets version. You can of course download the template use it with Excel instead. Let’s dive in!
Step 1: Settings
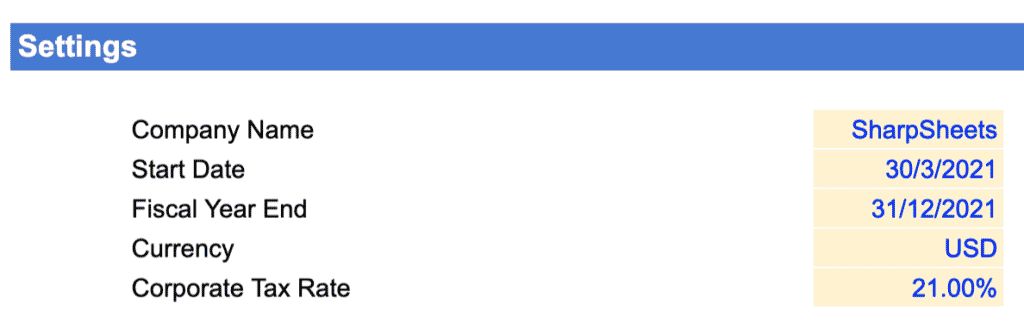
The first thing we need to do is to enter a few details in the Settings tab. They are:
- Company name: the name of your business / project
- Start date: the first month the model will forecast from. Note that the first month should be in the future, and it isn’t necessarily the following month. For instance, assuming we are today in July 2021, and you are raising capital which you expect to last 2 months, the start date can very well be September 2021 or even later.
- Fiscal year end: by definition, this is the date that defines the end of a 12-month period for accounting purposes. In our templates, this date is important as it will serve to calculate the annual summaries of your P&L, balance sheet and cash flow statement. Note that most businesses have 31st December as fiscal year end. When in doubt, ask your accountant.
Note: the year in the fiscal year end is not relevant. For instance, if your fiscal year ends on December 31st, 31/12/2021 and 31/12/2022 are exactly the same thing.
- Currency: the main currency of your business and in which you want to present your financials. Note that the currency does not impact any calculation: it is simply used as a legend throughout the model.
Note: if your business operates in different currencies, use the same currency throughout for your model. For instance, assuming you sell your products in USD but have some staff paid in EUR and your reporting currency is USD. In this case, the expenses (the salaries of the staff in EUR) should be converted in their USD equivalent when you enter your hiring plan (more on that below)
- Corporate tax rate: this is the tax rate you pay in your jurisdiction. If you aren’t sure which is yours, refer to KPMG’s exhaustive updated list here.
Step 2: Revenue
In the same Settings tab, we need to set a number of assumptions behind your revenue.
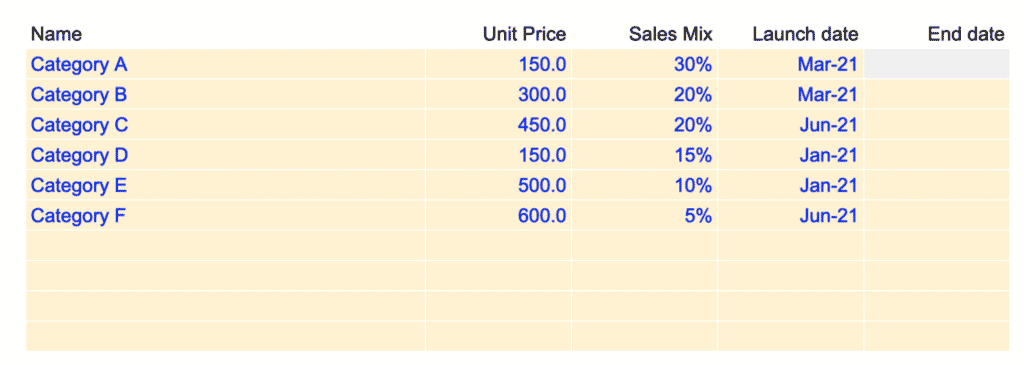
- Product name: the name of your products (or “SKUs”)
Note: the ecommerce financial model template allows for up to 10 different products. Of course, you might have more. Yet, for the purpose of the model and to ensure it is flexible (easy to manipulate), you will need to group all your SKUs into 10 categories maximum. Because the categories have separate unit price (see below), we recommend to group your products into price categories.
- Unit price: the sale price of your products per category. For instance, if you run a furniture shop, sofas would be at $1,500 and chairs at $150 in average
- Sales mix: the breakdown of your orders between the different categories. For instance, in our example above, if you have 100 orders in a given month, you would sell 30 products of category A, 20 of category B, and so on
- Launch date: the date from which you start to generate revenues from the relevant category. For instance, if you start your furniture online shop selling only sofas in September 2021, and launch chairs 6 months later you would enter Sept-21 (sofas) and Mar-21 (chairs)
- End date: the date when you discontinue your products (if any). If you do not plan to discontinue any products in the future, leave empty
Step 3: Acquisition
In the same Settings sheet, we need to change a few inputs affecting your acquisition: how to “acquire” customers. This is where we forecast the number of orders you generate over time.
Typically ecommerce businesses generate orders via online traffic (i.e. visitors landing on your online shop). Traffic is either paid (pay-per-click campaigns e.g. Google Ads) or organic (you do not pay for the clicks you generate).
3.1. Paid traffic
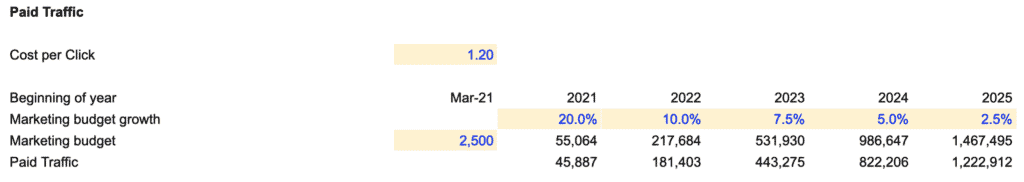
Paid traffic is by definition the number of visitors who land on your website via paid ads (Google Ads, social media, etc.). The number of paid visitors is obtained using the following formula:
Paid visitors = Paid marketing budget / Cost-per-click
For instance, assuming you spend $10,000 in paid marketing in a month, and your average CPC is $2, the number of paid clicks (or visitors) you generate is 5,000.
In order to estimate the numbers of paid visitors we need to set 3 assumptions:
- The average cost-per-click of all your campaigns. If you are running search and social media ads for instance, enter the average CPC. For more information about cost-per-click benchmarks per industry, have a look at our article here.
- The first month of your marketing budget spending. By default, the first month is the date of the launch of your first product category. The amount is the monthly budget you expect to spend in that month.
Example: Let’s assume you start your model in September 2021, and expect a 6 month development period during which you will not generate any revenues. You would set the launch of your first product in February 2022, and from this date onwards you would start to spend money in paid marketing to acquire paid traffic.
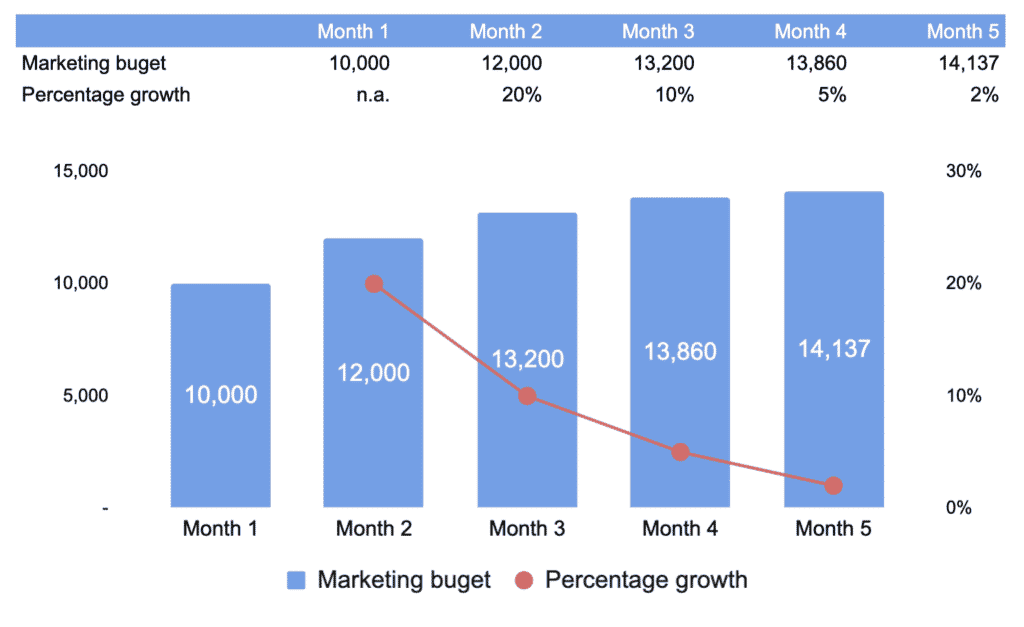
- The monthly growth of your marketing budget. This is a tricky one: you marketing budget will change over time (likely it will increase) from the first month you just set. As such, you will spend more in the future, and we need to estimate the amount of monthly marketing budget you will spend over time. This monthly marketing budget is calculated using a monthly percentage growth. Yet, because the monthly budgets will increase over time, the percentages themselves will decrease. In other words, you are still increasing your marketing budget over time, yet the positive percentage growth decreases. See below an illustration to make it clearer.
Note: the percentages are set at the beginning of each year. In our example above, monthly growth starts at 20% in the beginning of the first year, and decreases progressively down to 10% at the beginning of year 2, and so on.
3.2. Organic traffic
Organic traffic is the number of visitors you generate organically (unlike paid traffic for which you pay per click, or impressions). It works in a similar fashion as paid traffic. The only difference is that we do not have to set a cost-per-click here. Therefore the assumptions to set are:
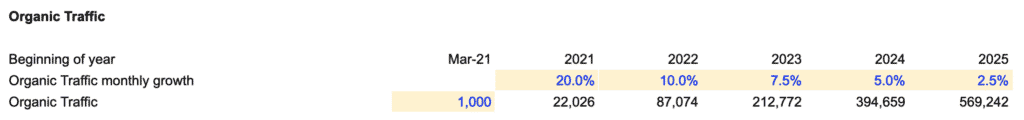
- First month organic traffic. The number of visitors you expect to generate in the first month (again, the date of the launch of your first subscription) from organic sources
- Organic traffic monthly growth. The same way marketing budget increases thanks to a percentage growth, organic traffic will do so too. Refer to paid traffic above for a refresher on how this works.
Step 4: Conversions
The ecommerce financial model template allows us to differentiate 2 types of customers:
- New customers: customers who make a purchase for the first time
- Repeat customers: customers who already made a purchase
The reason why we differentiate these 2 customers is important: repeat customers typically have higher conversion rates vs. new ones and, more importantly, you usually spend less for repeat customers conversions (they come back organically – but not always).
As such, repeat customers are an important part of ecommerce businesses: they are very profitable. in general, ecommerce businesses with high retention rates are more valuable than ecommerce businesses that only sell to first time customers.
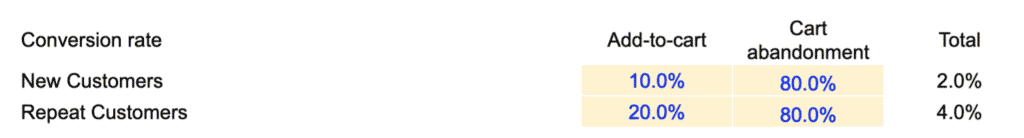
For each new and repeat customers we need to set 2 inputs:
- Add-to-cart rate: the percentage of visitors who place at least one item in their cart during the session
- Cart abandonment rate: the percentage of visitors who placed at least one time in their card but never made a purchase (they abandoned their cart)
Note: ecommerce cart abandonment rates vary by industry. In average, it is around 80% as per SalesCycle’s research here.
Conversion rate is then the result of the equation:
Conversion rate = add-to-cart rate x (1 – cart abandonment rate)
For instance, if add-to-cart is 20% and cart abandonment rate 80%, conversion rate is:
Conversion rate = 20% x (1 – 80%) = 4.0%
As explained earlier, it is common for repeat customers who have higher conversion rates vs. new customers. For instance, whilst new customers have 10% add-to-carts in average, repeat customers might have 20% instead, doubling conversion rates.
Note: if you have existing metrics, get the conversion rates from your dashboard (e.g. Google Analytics or your Shopify dashboard) by differentiating new vs. repeat customers.
Step 5: Retention
As explained earlier, ecommerce businesses have 2 types of customers: new and repeat customers.
Both types of customers are visitors (paid or organic) who convert on your website using the conversion rates above.
Visitors converting in new customers, as we saw already, are set up under Acquisition (Step 3).
In comparison, repeat customers are separate visitors: visitors who already made a purchase. In order to forecast these customers, we need to set a few assumptions:
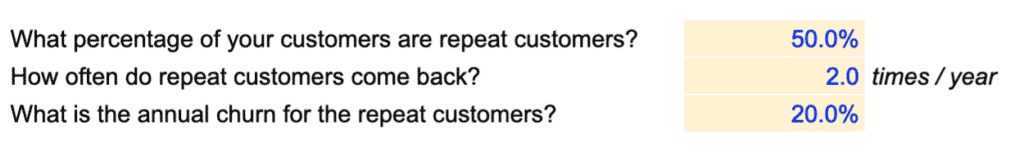
- What percentage of your customers are repeat customers? Not all your customers will ever come back to your online store in their lifetime. Some might buy once and never come back. Some might come back a few times a year (say every month), and make a purchase twice a year. Here we set the percentage of all your customers who belong to the second category. In other words, how many of your customers will ever come back in the future?
- How often do repeat customers come back? Here we set the frequency at which repeat customers come back to your online store. Are they visiting your website 2 times a year, or every month?
Note: when they visit your website, repeat customers do not necessarily make a purchase. They will make a purchase at a given conversion rate we would have set above. For instance, if repeat customers come back every month, they don’t necessarily buy 12 times a year. Instead they might only buy 5% of the time.
- What is the annual churn for the repeat customers? Typically, repeat customers do not buy indefinitely. Instead, they churn over time. Whether the churn rate is high or low depends on the type of products you sell and the success of your retention and cross-selling strategy. A rate of 20% for instance will mean that repeat customers churn after 5 years: they will stop visiting your website and making any purchase 5 years from now.
Step 6: COGS
Ecommerce businesses have a number of cost of goods sold (COGS) categories: unit costs, returns, cancellations, allowances for bad goods and discounts. Let’s see them one by one.
6.1. Unit costs
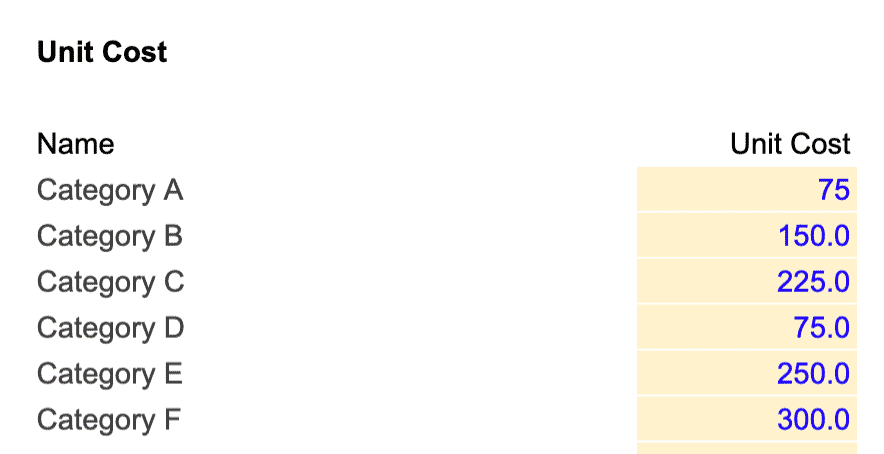
- Unit cost: the cost you incur to source the product from your supplier. For instance, in the example above, if you sell a products in category A at $150 in average and it costs you $75 to purchase.
6.2. Returns and cancellations
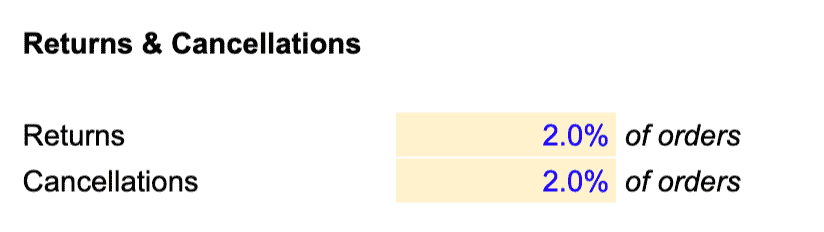
Unfortunately ecommerce businesses suffer from returns and cancellations. As such, you might make 100 sales at $20 a piece and record $2,000 revenue. Yet, 2 customers might return their products and another 5 cancel their order. In the end, whilst gross revenue is $2,000 net revenue only is $1,860.
The ecommerce financial model template allows you to forecast returns and cancellations by setting a percentage of total orders that ends up being cancelled or returned respectively.
Note: returns and cancellations are very different from a finance perspective. Indeed, whilst cancellations only incur payment processing fees (you still pay Stripe or Paypal for the money to be refunded back to your customers), returns are more expensive. For returns, you typically also spend fulfilment costs (including shipping, see below) at a loss.
6.3. Allowance for bad goods
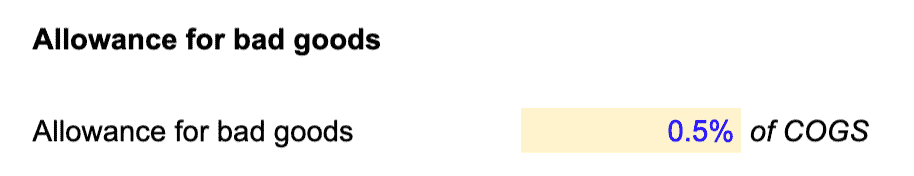
If you have some default goods (goods that do not function properly and can’t be sold), you may have to pay for them. Unfortunately this is an expense as you purchase the goods but cannot sell them. Allowance for bad goods is very often overlooked, yet it can cost you thousands of dollars if not more every year, so be sure to account for them.
In the ecommerce financial model template you can set allowance for bad goods by setting a percentage of your unit costs (see above) that you are paying for but will not sell.
Note: if the goods are default at delivery, very likely this will be borne by your supplier (and not you). Refer to your contract clauses to be sure where the liability lies.
6.3. Discounts

The ecommerce financial model template allows you to factor discounts as a percentage of Gross Merchandise Value (gross revenue). For instance, if you offer 10% discounts in average for all your products, enter 10% here.
Step 7: Fulfilment
Fulfilment expenses are all the costs you incur to fulfil orders: from warehousing to handling, packaging and shipping.
The template is flexible and works for any type of ecommerce business. It works for ecommerce businesses that have in-house and outsourced fulfilment. The difference between the two can be summed up below:
- In-house fulfilment: you manage yourself the packaging, shipping and handling of your orders. As such, you have your own warehouse and operators handling the orders, and you ship yourself (or outsource) shipping and packaging.
- Outsourced fulfilment: fulfilment is outsourced to a third-party who manages all the different steps (warehousing, handling, packaging and shipping). Typically, you pay a fixed price per order. Amazon FBA is an example of an outsourced fulfilment provider.
Let’s start with outsourced fulfilment.
7.1. Outsourced fulfilment

If you outsource fulfilment to a 3rd party provider, enter the corresponding average cost per order here. For an Amazon FBA fulfilment fees for instance, refer to the list here.
For instance, if you pay in average $5 per order and make 100 orders in a month, fulfilment costs are $500. This means you do not spend anything else in shipping, warehousing, packaging, handling: all these costs are already included within the fulfilment cost per order.
7.2. In-house fulfilment
If you do not outsource fulfilment to a 3rd party, you need to set assumptions separately for the different categories below.
7.2.1. Handling costs
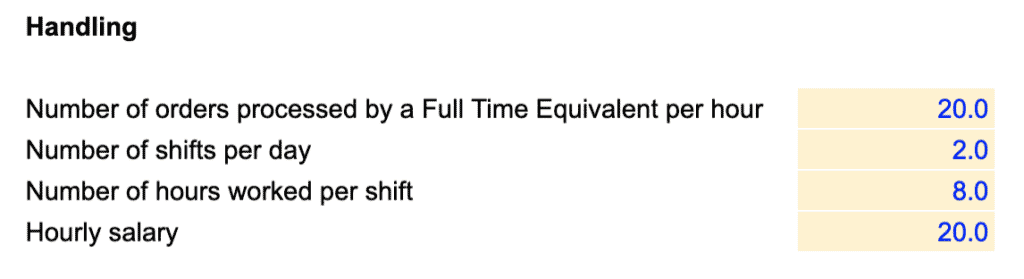
Handling costs are the salaries you pay the operators who handle the orders (they sort them, package them and prepare them for delivery). Therefore, handling costs are a function of the number of orders you have, and the efficiency of your operators. The assumptions you need to set are:
- Number of orders processed by an Operator per hour. This sets the efficiency of your operators. Can 1 person prepare 10 orders an hour (small electronics for instance) or only 1 (furniture for example)?
- Number of shifts per day: the number of shifts for the operators. Do you operate 1 shift per day from 9am – 5pm or 3 shifts covering 24/7?
- Number of hours worked per shift. Operators might be paid 8 hours but they might not be effectively working 8 hours but 6 or 7 instead (count lunch time and other breaks)
- Hourly salary: the cost per hour of your operators (including taxes and benefits)
7.2.2. Warehousing costs
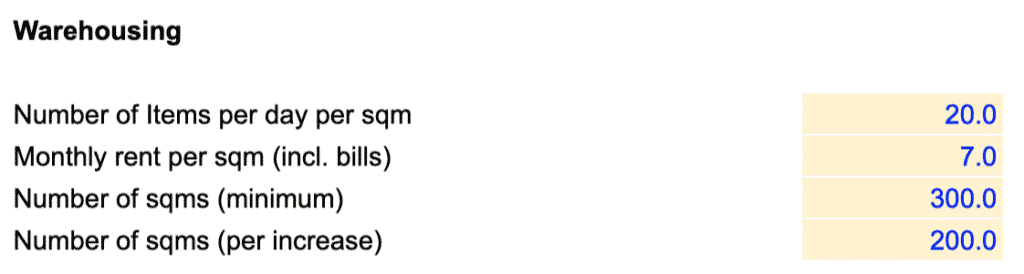
Warehouse costs are a function of the number of orders you have. Of course, a warehouse isn’t a variable cost either: you increase warehouse costs by adding up another warehouse space, maybe every year or so.
Still, the ecommerce financial model template allows you to forecast the cost of the lease of your warehouse depending on a number of assumptions:
- Numbers of items per day per sqm. This number depends on the size of your SKUs (products). The higher the number, the more orders you can process per sqm.
- Monthly rent per sqm (including bills). The monthly rent of your warehouse per sqm (including bills)
- Number of sqms (minimum). This is the minimum number of sqms for your warehousing operations. For instance, if you start operations with a 300 sqms warehouse and plan to add more surface as you grow, enter 200 here.
- Number of sqms (per increase). As said earlier, warehousing costs aren’t fully variable. So, when you increase, you typically rent another warehouse (additional space or you replace your existing space with a bigger warehouse). The number here is the number of sqms per incremental increases of surface. For instance, if you plan to add a new space every time you are at full capacity by an increment of 200 sqms, enter 200 here. As such, using our example above, if you have 301 orders in a month, you will need to open a new warehouse so you have 500 capacity in total.
7.2.3. Packaging costs
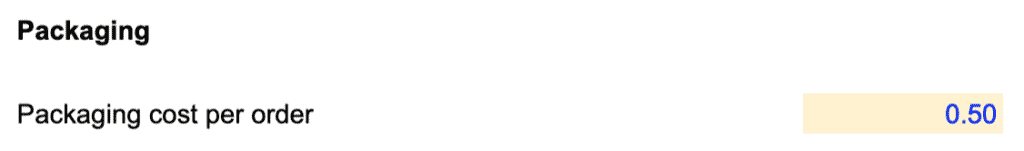
Enter here the amount you spend per order for packaging.
7.2.4. Shipping costs
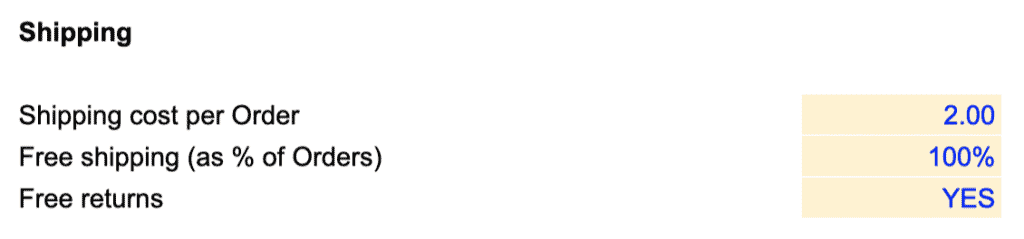
Shipping costs are two-fold: the costs you incur when sending the products to your customers and when they return them. Therefore, to forecast shipping costs we need to change 3 assumptions:
- Shipping cost per order: the total cost you incur to send one product (or return it). This can be in-house shipping (your own couriers) or 3rd party costs (mail for instance)
- Free shipping. Set the percentage of total orders for which you pay for shipping. If you do not pay for shipping (but your customers do), leave 0%
- Free returns. choose here whether you pay for return shipping (enter “Yes”) or whether your customers need to pay for it (enter “No”)
Step 8: Hiring Plan
One of the biggest expense category of Ecommerce businesses often is salaries. It is therefore very important to set up your future roles and their related expenses (salaries, bonuses) correctly.
8.1. Teams
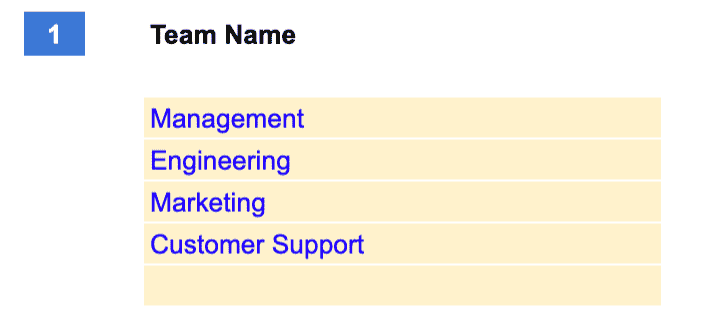
The first thing we need to do is to list the different teams you have and group them into up to 5 categories. This will allow us to differentiate salaries into the different teams in your P&L and your metrics later on.
Note: if you selected inbound acquisition under Acquisition (section 3 above) earlier you will need to enter at least a “Sales” team so the template can calculate correctly the number of Sales people that generate customers in the Acquisition sheet.
8.2. Roles
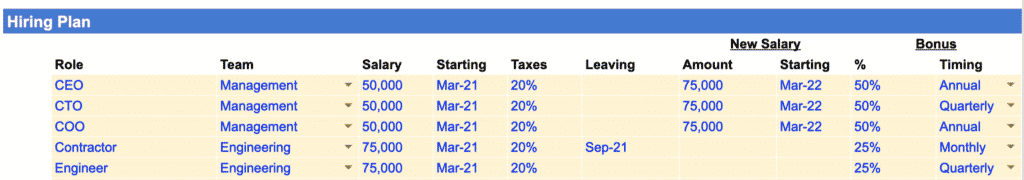
In the Hiring Plan sheet, you will need to enter all the roles you expect to hire in the future. For each, you will need to enter (as shown in the table above), in order:
- Role: either the role or the name of the recruit
- Team: drop-down list to select the name of the team the role falls into (the teams are the ones we set up earlier)
- Salary: the annual gross salary
- Starting: the date when you expect to hire the role.
Note: if you already have existing roles before the start of the model, enter the date in the future you recruited the role. For instance, if you are CEO and started to work since January 2021 but the first date you project your financials from is September 2021, enter January 2021 as the starting date for CEO.
- Taxes: any taxes and benefits you incur on top of salary, expressed as a percentage of gross annual salary
- Leaving. If you have contractors with fixed term employment contracts for instance, enter the date at which you will not employ that role anymore
- New salary amount. If you expect to increases salaries in the future of certain roles, enter the new annual gross salary here
- New salary starting date: the date you start to pay the new salary
- Bonus %. If you pay bonuses on top of salary to certain roles, enter the corresponding percentage of annual gross salary you pay each year as a cash bonus.
- Bonus timing. Here you can set whether you pay bonuses every month, quarter or yearly.
Step 9: Expenses
In the Settings sheet you can enter a number of assumptions for the ecommerce financial model template to calculate automatically the expense amounts in Expenses.
9.1. Payment processing fees
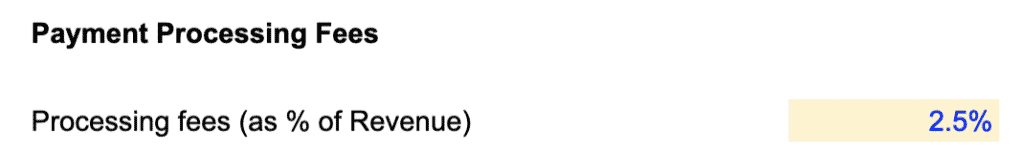
Enter the percentage of revenues you will pay to your payment processing provider (e.g. Stripe, Paypal, etc.)
9.2. Customer Support
The ecommerce financial model template gives you the ability to forecast Customer Support in 2 different ways, either:
- Enter the customer support roles one by one in the Hiring Plan as shown above; or
- Forecast customer support salaries as a function of the number of users you have
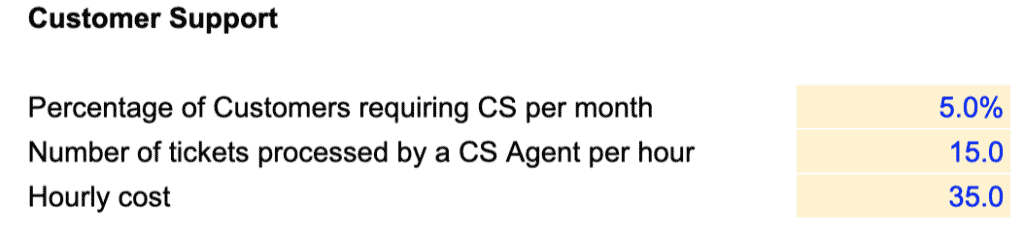
We are covering here the 2nd approach. Customer support salaries will be calculated by taking into account 3 different assumptions which you will need to set:
- Percentage of customers requiring customer support per month. Let’s assume you have 1,000 active customers in a month, not all might contact your customer support service. For instance, if a customer calls your CS say, every 2 months, enter 50% (indeed, 50% of all active customers contact CS every month, ie every 2 months)
- Number of tickets processed by a customer support agent per hour. Here we set the “efficiency” of your customer support team. If you are a Enterprise SaaS business, the tickets may take more time to be processed (hence an agent might only process a handful per hour). In comparison, if your tickets are usually dealt via email within a few minutes (e.g. B2C SaaS) enter a higher number here
- Hourly cost of a customer support agent. This is the total hourly cost you pay your customer support agents (including taxes and benefits, if any)
Note: If customer support is outsourced to a 3rd party instead (to Teleperformance for instance), simply enter here the hourly cost you pay per customer agent.
9.3. Hosting
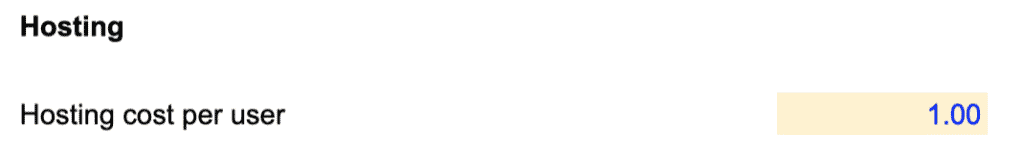
Enter here the amount you spend per month per user in hosting, tech infrastructure, etc. If unsure, ask you your CTO.
9.4. Team expenses
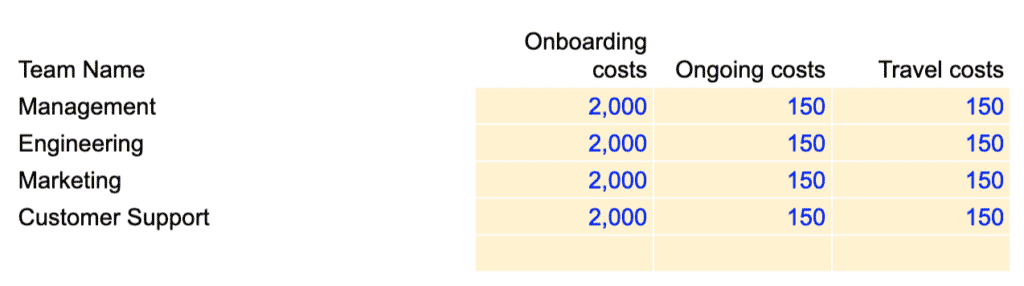
For each team, you have the ability to set a spending per role, it includes:
- Onboarding costs: any one-off you incur when you hire a role (computer, desk, etc.)
- Ongoing costs: any recurring expenses you incur per month per role (subscription, meal allowances, etc.)
- Travel: the travel allowance per role per month. Management and sales team may travel more than the engineering team for instance, so you can differentiate them here.
9.5. Other expenses
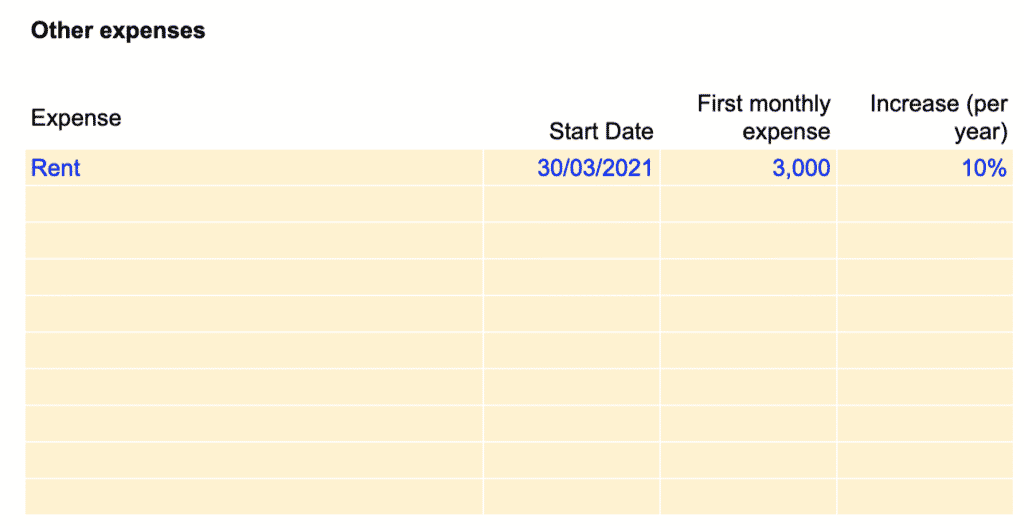
Enter here any other recurring expenses you haven’t included yet. For each expense there are 4 assumptions to set:
- Expense: the name of the expense
- Start date: the date from which you start to incur such expense
- First monthly expense: the amount of the first month
- Increase (per year): the percentage increase (per year) at which the expense grows over time (if it does)
Note: if the expense stays flat over time, leave percentage increase to zero instead.
Step 10: Balance sheet
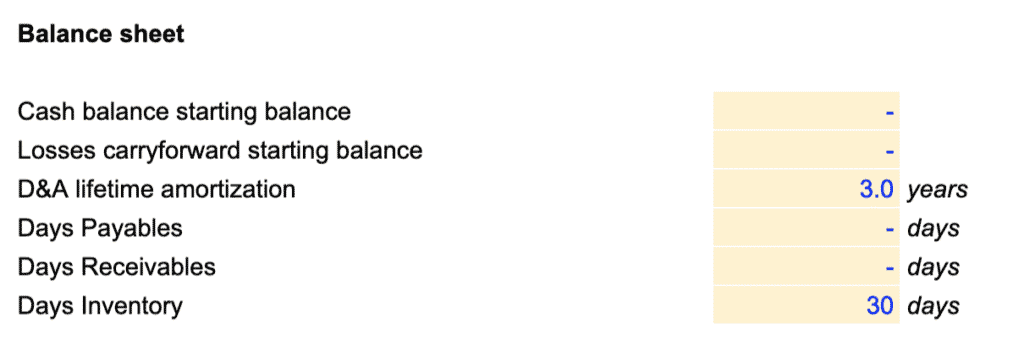
- Cash starting balance: the amount of cash you already have in the bank before the start of the model
Note: do not include the fundraising round (see below) you expect to raise here. It will be added automatically to your cash balance.
- Losses carry-forward starting balance. If you have any tax credit from your state, enter the amount here. For a refresher on what losses carry-forward, see Investopedia’s definition here
- D&A lifetime amortisation. Any capex you will spend in the future (see below) will be depreciated over time. This is where you select the depreciation schedule. If in doubt, ask your accountant
Now we need to a few assumptions to forecast working capital:
- Days Payables (or Days Payables Outstanding – DPO): the average number of days it takes your company to pay your suppliers. A high DPO means it takes longer for a business to pay its bills, meaning it can also retain the funds it owes its suppliers to spend them somewhere else to maximise benefits. In average, ecommerce businesses pay their suppliers 50/50: 50% at order, and 50% at delivery. As such, for most ecommerce businesses, days payables is zero to 30 days (they pay the full amount at the time of delivery, or 30 days later which is usually the maximum allowed delay).
- Days Receivables (or Days Sales Outstanding – DSO): the average number of days it takes your customers to you. All ecommerce businesses typically collect payment at order, hence DSO is zero.
- Days Inventory (or Days Inventory Outstanding – DIO): the average number of days it takes your company to turn its inventory into sales. Generally, a lower DIO is best as it indicates a shorter duration to clear off the inventory.
Note: if you operate a dropshipping business, DIO is zero. Indeed, you do not have any inventory as you ship the products straight from your supplier to your customers.
Step 11: Fundraising
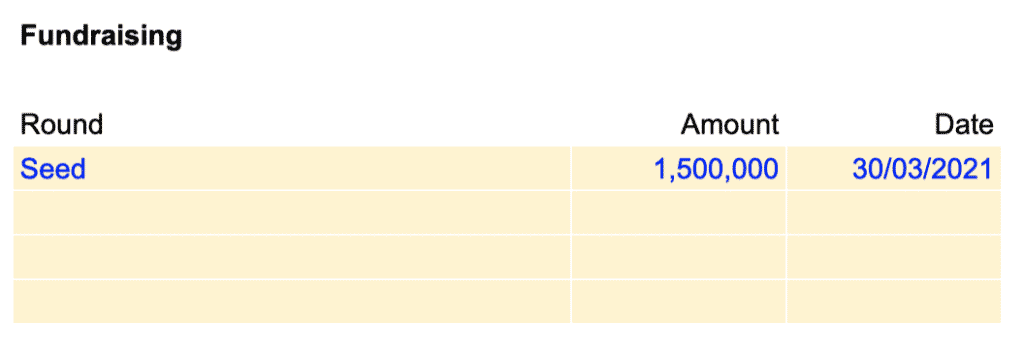
This is where you can set the fundraising rounds you expect in the future. Set here 3 assumptions:
- Round: name of the round (e.g. Seed, Series A, etc.)
- Amount: the amount you expect to raise from this round
- Date: the date of the round
Ecommerce Financial Model Template
Download an expert-built 5-year Excel financial model for your pitch deck
Ecommerce Financial Model Template
Download an expert-built 5-year Excel financial model for your pitch deck