
A&W Restaurants Franchise FDD, Profits, & Costs

A&W Restaurants is a historic brand in American dining, offering a unique franchise opportunity since 1919. As the oldest restaurant franchise in the U.S., A&W is known for its iconic root beer served in frosty mugs, a tradition that started at a roadside stand in Lodi, California. Roy W. Allen and Frank Wright, who formed the brand name A&W, set the foundation for its enduring success.
The franchise began expanding in 1926 and has grown worldwide while maintaining its core values. Headquartered in Lexington, Kentucky, A&W remains a beloved destination for generations. The brand’s ability to adapt through economic challenges, including the Great Depression, showcases its resilience.
Today, A&W continues to evolve by incorporating modern technology like self-service kiosks and a centralized POS system, enhancing the customer experience while staying true to its century-old heritage.

Initial Investment
How much does it cost to start a A&W Restaurants franchise? It costs on average between $299,000 – $1,640,000 to start a A&W Restaurants franchised restaurant.
This includes costs for construction, equipment, inventory, and initial operating expenses. The exact amount depends on various factors, including the type of restaurant you choose, the location, and whether the franchisee chooses to lease or purchase the property. Indeed, A&W Restaurants offers 3 types of franchises:
| Type of Expenditure | Amount |
|---|---|
| Freestanding Restaurant | $894,434 to $1,639,906 |
| In-line Restaurant | $424,434 to $1,129,183 |
| Captive Restaurant | $298,899 to $724,971 |
We are summarizing below the main costs associated with opening a A&W Freestanding Restaurant franchise. For more information on costs required to start an A&W franchise, refer to the Franchise Disclosure Document (Item 7).
| Type of Expenditure | Amount |
|---|---|
| Professional Fees, Licenses & Permits | $30,000 – $84,000 |
| Building Costs Including Site Work | $500,000 – $869,484 |
| Signs | $70,000 – $87,658 |
| Technology System | $33,534 – $69,723 |
| Furnishings, Fixtures & Equipment | $184,900 – $275,639 |
| Sub-total | $818,434 – $1,386,504 |
| Initial Franchise Fee | $15,000 – $30,000 |
| Grand Opening Promotion Deposit | $5,000 |
| Management Training Course Expenses | $3,000 – $10,000 |
| On-Site Team Member Training Expenses | $8,000 – $30,000 |
| Miscellaneous Opening Costs | $6,000 – $12,402 |
| Opening Inventory | $9,000 – $16,000 |
| Additional Funds – 3 Months | $30,000 – $150,000 |
| TOTAL (excl. real estate costs) | $894,434 – $1,639,906 |
Average Revenue (AUV)
How much revenue can you make with a A&W Restaurants franchise? A A&W Restaurants franchised restaurant makes on average $1,037,000 in revenue (AUV) per year.
Here is the extract from the Franchise Disclosure Document:
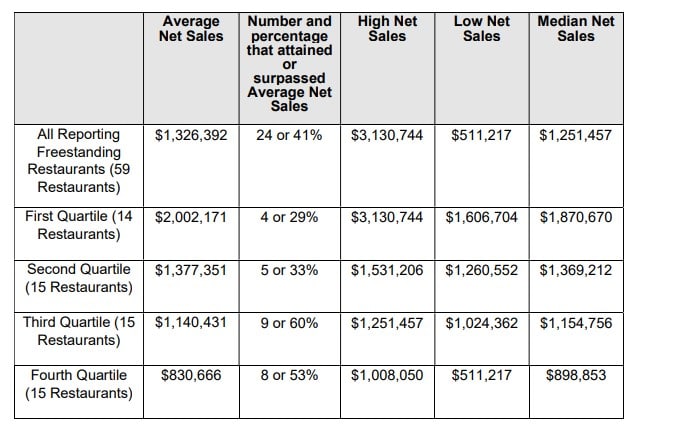
This compares to $1,548,000 yearly revenue for similar burger franchises.
A&W Restaurants Franchise Disclosure Document
Frequently Asked Questions
How much can a A&W Restaurants franchise owner expect to earn?
The average gross sales for a A&W Restaurants franchise are approximately $1.04 million per location. Assuming a 15% operating profit margin, $1.04 million yearly revenue can result in $156,000 EBITDA annually.
What funding options are available for a A&W Restaurants franchise?
Most franchise buyers in A&W Restaurants’s investment range finance their unit through an SBA 7(a) loan, with some multi-unit operators using SBA 504 loans for real estate. Buyers with rollable retirement funds sometimes use a ROBS structure to reduce debt service. See SharpSheets’ financial model hub for funding guidance.
How long does it take to pay back a A&W Restaurants franchise investment?
Payback periods for franchises in A&W Restaurants’s category typically run 3-7 years, depending on investment level, location performance, and financing structure. Actual payback varies significantly by unit performance and debt service obligations.
Who owns A&W Restaurants?
A&W Restaurants is owned by A Great American Brand, LLC, which is a group of franchisees who purchased the company from Yum! Brands in 2011.
This unique ownership structure means that the brand is 100% franchisee-owned, making it one of the few major restaurant chains that operates under franchisee control.
SharpSheets Editorial Team | sharpsheets.io | Last Updated: June 2026
Disclaimer
Disclaimer: This content has been made for informational and educational purposes only. SharpSheets is an independent educational resource and is not affiliated with, endorsed by, or representing any franchisor mentioned on this website. Where noted, figures are taken from the franchisor’s Franchise Disclosure Document (FDD). In some cases, we may provide independent calculations or estimates based on publicly available information. We do not make any representation or warranties with respect to the accuracy, applicability, fitness, or completeness of the information presented in the article. You should not construe any such information or other material as legal, tax, investment, financial, or other professional advice. Nothing contained in this article constitutes a solicitation, recommendation, endorsement, advertisement, or offer to buy or sell any franchises, securities, or other financial instruments in this or in any other jurisdiction in which such solicitation or offer would be unlawful under the franchise and/or securities laws of such jurisdiction.
All content in this article is information of a general nature and does not address the detailed circumstances of any particular individual or entity. Nothing in the article constitutes professional and/or financial and/or legal advice, nor does any information in the article constitute a comprehensive or complete statement of the matters discussed or the law relating thereto. You alone assume the sole responsibility of evaluating the merits and risks associated with the use of any information or other content in this article before making any decisions based on such information or other content.


