- Templates
- About our templates
- All our financial model templates are built and customised for specific businesses and industries.
- Search 250+ templates:
- By industry: 100+ templates for specific business models (SaaS, ecommerce, hotels, restaurants, retail stores, etc.)
- Franchises: 250+ templates built specifically for franchisees, from restaurants, gyms, home services and more
- About our templates
- By industry
- Franchises
- About our templates
- Blog
- Help
Black Bear Diner Franchises: $2.4M AUV and 25% Profit Margins
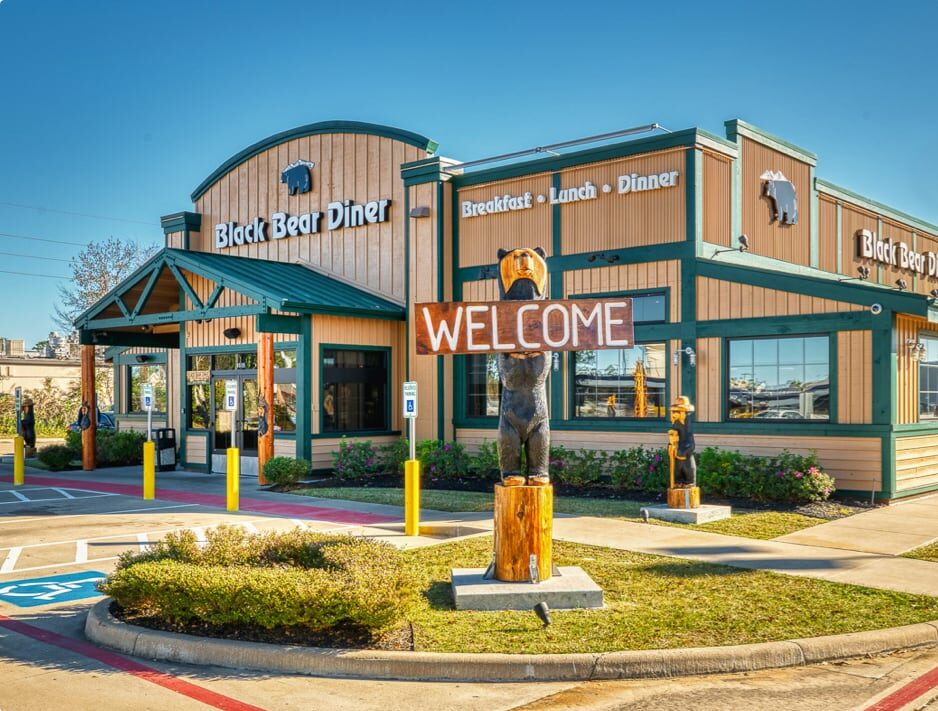
Even though not the largest diner chain, Black Bear Diner is a very popular franchise among franchisees. With 140 restaurants in the US alone, Black Bear Diner can also be a very profitable venture.
Indeed, the Average Unit Volume is $2.4 million, higher than the average fast casual restaurant franchise whilst the investment upfront is in line with the industry at $1.7 million.
Should you invest in a Black Bear Diner franchise? How much profits can you make with a Black Bear Diner restaurant? Are the profits worth the cost?
We’ll answer all these questions in this article by looking at the financial information provided in the latest Franchise Disclosure Document. Let’s dive in!
Black Bear Diner franchises: key figures
Franchise fee | $55,000 |
Royalty fee | 4.5% |
Marketing fee | 2.0% |
Investment (mid-point) | $1,694,000 |
Average sales | $2,361,000 |
Sales to investment ratio | 1.4x |
Payback period* | 5 years |
Minimum net worth | $1,500,000 |
Minimum liquid capital | $500,000 |
What is Black Bear Diner?
Black Bear Diner is an American restaurant chain known for its “home-style” and “old-fashioned” comfort foods. It is headquartered in Redding, California.
The chain was founded by Bruce Dean and Bob&Laurie Manley in Mount Shasta, California.
It serves burgers, salads, eggs, bacon, sandwiches, shakes, and a variety of pies. Black Bear Diner started franchising in 2002 and has more than 140 restaurants in 14 US states.
Black Bear Diner franchises pros and cons
Pros
- Site selection and construction: The franchisor has an experienced real estate team to help its franchisees establish and build their restaurants. It helps them with site selection, proprietary demographic and analytic tools, layout, design, and construction.
- Pre-opening training: The brand has a detailed hands-on training program as well as classroom and ongoing training on running their restaurants successfully. It trains its franchisees on culinary procedures, restaurant operations, and management best practices.
- Marketing support: Black Bear Diner embraces a dedicated marketing and advertising department. Franchisees benefit from the development of local store marketing programs, social media monitoring and posting, website maintenance, media planning and placement, and year-round marketing program measurement.
Cons
- Not a passive investment: Black Bear Diner does not allow for absentee ownership. Franchisees must be actively involved in the decision-making and day-to-day operations of the restaurants.
- Not a part-time business. The franchise is not a part-time business opportunity. Franchisees must follow the parent company’s working hours.
- Competition: Black Bear Diner experiences a lot of competition from other brands in the industry, such as IHOP, Denny’s and Buffalo Wild Wings to name a few
How much does it cost to own a Black Bear Diner franchise?
On average, you may need to invest around $1,694,000 to open a new Black Bear Diner restaurant.
Please note that the investment amount can vary. Because it is an average and depends on factors like location, restaurant size, etc. Generally, this amount ranges between $1,193,800 and $2,194,200.
Black Bear Diner franchises startup costs
The investment covers all the startup costs you may need to pay to open a new restaurant. In addition to an initial franchise fee ($24,000 – $55,000 depending on the restaurant format), the investment pays for the following startup costs:
- Formation Costs: security deposits, licenses & permits, leasehold improvements, furniture, fixtures, kitchen equipment, signage, professional fees, training expenses, etc.
- Initial Marketing: grand opening advertising
- Operating Costs: first month’s rent, insurance, initial inventory of food, paper, and gift shop products, and working capital for first 3 months.
Type of cost | Low | High |
---|---|---|
Initial Franchise Fee | $24,000 | $55,000 |
Formation Costs | $1,034,300 | $1,912,200 |
Initial Marketing | $5,500 | $12,000 |
Operating Costs | $130,000 | $215,000 |
Total | $1,193,800 | $2,194,200 |
What’s the AUV of a Black Bear Diner franchise?
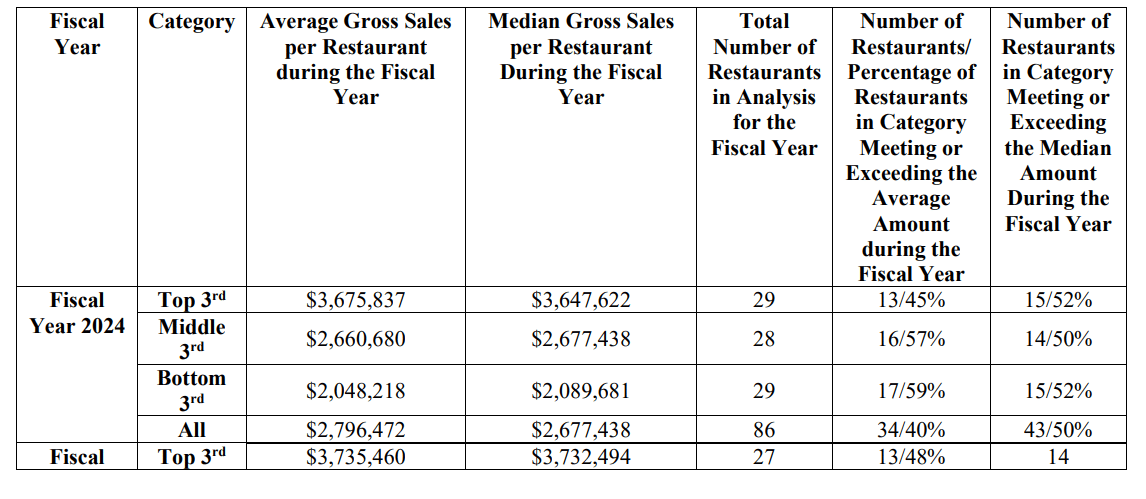
On average, a Black Bear Diner franchise has an Average Unit Volume of $2,361,044 per year.
This represents the median annual turnover of 76 franchised restaurants operating in the 2021 fiscal year. As you can see below, following a dip in 2020 due to the pandemic, Black Bear Diner franchises have recovered in 2021 (+58.7% revenue growth in 2021 vs. 2020).
Year | AUV | % change |
---|---|---|
2019 | $2,433,685 | – |
2020 | $1,487,943 | -38.9% |
2021 | $2,361,044 | 58.7% |
How profitable is a Black Bear Diner franchise?
We estimate that a Black Bear Diner franchised restaurant makes on average $579,368 in profits per year. This represents s 25% profit margin (adjusted EBITDA margin).
The 25% adjusted EBITDA margin is in line compared to similar franchises as per our intelligence (~25-27% industry average).
Note that Black Bear Diner does not disclose cost information for its franchises. Indeed, we had to use the company-affiliated restaurant data for COGS (27.3% sales) and labor costs (34.8%) to estimate this number (see below).
Profit and loss | Amount | % of sales |
---|---|---|
Sales | $2,361,044 | 100% |
COGS | $(644,565) | 27.3% |
Labor | $(821,643) | 34.8% |
Rent | $(162,000) | 6.9% |
Royalty + marketing fees | $(153,468) | 6.5% |
Adjusted EBITDA | $579,368 | ~25% |
Should you invest in a Black Bear Diner franchise?
To answer this question, we need to investigate whether the profits are worth investing the initial startup costs to open a new Black Bear Diner restaurant.
In other words, are the net profits worth the required investment of $1,694,000 on average?
Assuming a net profit margin of 15% of revenue, which makes sense given adjusted EBITDA is 25% of sales, we found Black Bear Diner has a payback period of 4.8 years on average. This is a very good payback period for a restaurant franchise.
Therefore Black Bear Diner seems like a great investment opportunity as a franchisee. Yet, keep in mind this number has been calculated using the average performance of the restaurants as disclosed in the latest Franchise Disclosure Document. It’s important to note that your restaurant may perform better or worse than the average.
How does it compare vs. other franchises?
Franchise | Investment ($) | Sales ($) | Payback (years) | Min. net worth ($) | Min. liquid capital ($) | |||
---|---|---|---|---|---|---|---|---|
Chick-Fil-A | https://sharpsheets.io/blog/chick-fil-a-franchise-costs-profits/ | Chicken | 1,363,510 | 4,227,417 | 3.1 | 2.2 | - | - |
Dunkin' Donuts | https://sharpsheets.io/blog/dunkin-donuts-franchise-costs-profits/ | Donuts | 779,000 | 1,056,521 | 1.4 | 4.9 | 500,000 | 250,000 |
Domino's | https://sharpsheets.io/blog/dominos-franchise-profits-costs/ | Pizza | 398,725 | 1,286,428 | 3.2 | 3.9 | 250,000 | 75,000 |
Krispy Kreme | https://sharpsheets.io/blog/krispy-kreme-franchise-costs-profits/ | Donuts | 824,000 | 3,400,000 | 4.1 | 1.6 | 2,000,000 | 300,000 |
Little Caesars | https://sharpsheets.io/blog/little-caesars-franchise-costs-profits/ | Pizza | 1,022,850 | 798,113 | 0.8 | 8.5 | 350,000 | 150,000 |
Wingstop | https://sharpsheets.io/blog/wingstop-franchise-costs-profits/ | Chicken | 631,695 | 1,460,459 | 2.3 | 2.9 | 1,200,000 | 600,000 |
Steak 'n Shake | https://sharpsheets.io/blog/steak-n-shake-franchise-costs-profits/ | Burger, Milshakes | 815,626 | 1,346,332 | 1.7 | 4.0 | 1,500,000 | 500,000 |
Crumbl Cookies | https://sharpsheets.io/blog/crumbl-cookie-franchise-cost-profits/ | Sweets | 507,224 | 1,582,090 | 3.1 | 2.1 | 300,000 | 150,000 |
Taco Bell | https://sharpsheets.io/blog/taco-bell-franchise-costs-profits/ | Mexican | 462,413 | 1,650,000 | 3.6 | 1.9 | 1,500,000 | 750,000 |
Popeyes | https://sharpsheets.io/blog/popeyes-franchise-costs-profits/ | Chicken | 1,095,783 | 1,444,617 | 1.3 | 5.1 | 1,000,000 | 500,000 |
Smoothie King | https://sharpsheets.io/blog/smoothie-king-franchise-costs-profits/ | Smoothie | 688,108 | 573,269 | 0.8 | 8.0 | 300,000 | 100,000 |
Jersey Mike's | https://sharpsheets.io/blog/jersey-mikes-franchise-costs-profits/ | Sandwich | 574,323 | 1,220,586 | 2.1 | 4.7 | 300,000 | 100,000 |
Nothing Bundt Cakes | https://sharpsheets.io/blog/nothing-bundt-cakes-franchise-costs-profits/ | Sweets | 538,650 | 1,307,280 | 2.4 | 2.7 | 600,000 | 150,000 |
Jimmy John's | https://sharpsheets.io/blog/jimmy-johns-franchise-costs-profits/ | Sandwich | 513,650 | 874,845 | 1.7 | 3.9 | 300,000 | 80,000 |
Texas Roadhouse | https://sharpsheets.io/blog/texas-roadhouse-franchise-costs-profits/ | Steakhouse | 4,209,500 | 2,955,534 | 0.7 | 9.5 | n.a. | 200,000 |
Kung Fu Tea | https://sharpsheets.io/blog/kung-fu-tea-franchise-costs-profits/ | Bubble tea | 250,125 | 353,237 | 1.4 | 4.7 | n.a. | 25,000 |
Wendy’s | https://sharpsheets.io/blog/wendys-franchise-cost-profits/ | Burger | 1,374,833 | 1,791,231 | 1.3 | 5.1 | 1,000,000 | 500,000 |
Burger King | https://sharpsheets.io/blog/burger-king-franchise-costs-profits/ | Burger | 1,242,950 | 1,215,970 | 1.0 | 6.8 | 1,500,000 | 500,000 |
Sonic Drive-In | https://sharpsheets.io/blog/sonic-drive-in-franchise-costs-profits/ | Burger | 1,467,083 | 1,617,000 | 1.1 | 6.0 | 1,000,000 | 500,000 |
Panera Bread | https://sharpsheets.io/blog/panera-bread-franchise-costs-profits/ | Sandwich | 2,290,500 | 2,599,432 | 1.1 | 5.9 | 7,500,000 | 3,000,000 |
Pizza Hut | https://sharpsheets.io/blog/pizza-hut-franchise-costs-profits/ | Pizza | 935,575 | 906,911 | 1.0 | 6.9 | 700,000 | 350,000 |
KFC | https://sharpsheets.io/blog/kfc-franchise-costs-profits/ | Chicken | 1,802,050 | 1,567,474 | 0.9 | 7.7 | 1,500,000 | 750,000 |
Arby’s | https://sharpsheets.io/blog/arbys-franchise-costs-profits/ | Sandwich | 1,184,975 | 1,126,263 | 1.0 | 7.0 | 1,000,000 | 500,000 |
Dairy Queen | https://sharpsheets.io/blog/dairy-queen-franchise-costs-profits/ | Ice Cream | 1,404,220 | 1,143,180 | 0.8 | 8.2 | 750,000 | 400,000 |
Jack in the Box | https://sharpsheets.io/blog/jack-in-the-box-franchise-costs-profits/ | Burger | 2,195,800 | 1,755,503 | 0.8 | 12.5 | 1,000,000 | 250,000 |
Papa John’s | https://sharpsheets.io/blog/papa-johns-franchise-costs-profits/ | Pizza | 353,695 | 1,101,127 | 3.1 | 2.1 | 750,000 | 250,000 |
Zaxby’s | https://sharpsheets.io/blog/zaxbys-franchise-costs-profits/ | Chicken | 534,750 | 2,229,187 | 4.2 | 2.4 | 1,000,000 | 500,000 |
Hardee’s | https://sharpsheets.io/blog/hardees-franchise-costs-profits/ | Burger | 1,759,000 | 1,147,975 | 0.7 | 10.2 | 1,000,000 | 300,000 |
Culver’s | https://sharpsheets.io/blog/culvers-franchise-costs-profits/ | Burger | 4,044,500 | 3,051,762 | 0.8 | 8.8 | 2,000,000 | 350,000 |
Five Guys | https://sharpsheets.io/blog/five-guys-franchise-costs-profits/ | Burger | 511,225 | 1,203,366 | 2.4 | 2.8 | 500,000 | 250,000 |
Carl’s Jr. | https://sharpsheets.io/blog/carls-jr-franchise-costs-profits/ | Burger | 1,860,335 | 1,419,516 | 0.8 | 8.7 | 1,000,000 | 500,000 |
Baskin-Robbins | https://sharpsheets.io/blog/baskin-robbins-franchise-costs-profits/ | Ice Cream | 465,100 | 316,815 | 0.7 | 9.8 | 250,000 | 125,000 |
IHOP | https://sharpsheets.io/blog/ihop-franchise-costs-profits/ | Pancakes | 2,058,302 | 1,553,311 | 0.8 | 8.8 | 1,500,000 | 500,000 |
Applebee’s | https://sharpsheets.io/blog/applebees-franchise-costs-profits/ | Casual American | 5,137,966 | 2,356,965 | 0.5 | 14.5 | 1,000,000 | 500,000 |
Denny's | https://sharpsheets.io/blog/dennys-franchise-costs-profits/ | Casual American | 3,785,459 | 1,639,549 | 0.4 | 15.4 | 1,000,000 | 500,000 |
Papa Murphy's | https://sharpsheets.io/blog/papa-murphys-franchise-costs-profits/ | Pizza | 433,174 | 580,441 | 1.3 | 5.0 | 275,000 | 125,000 |
Auntie Anne's | https://sharpsheets.io/blog/auntie-annes-franchise-costs-profits/ | Pretzels | 229,692 | 343,135 | 1.5 | 5.6 | 300,000 | 100,000 |
Firehouse Subs | https://sharpsheets.io/blog/firehouse-subs-franchise-costs-profits/ | Sandwich | 613,186 | 888,356 | 1.4 | 4.6 | 350,000 | 100,000 |
Tropical Smoothie Cafe | https://sharpsheets.io/blog/tropical-smoothie-cafe-franchise-costs-profits/ | Smoothie | 430,500 | 961,969 | 2.2 | 3.0 | 350,000 | 125,000 |
Marco’s Pizza | https://sharpsheets.io/blog/marcos-pizza-franchises-costs-profits/ | Pizza | 437,625 | 895,523 | 2.0 | 3.3 | 400,000 | 100,000 |
Cinnabon | https://sharpsheets.io/blog/cinnabon-franchises-costs-profits/ | Sweets | 276,062 | 394,897 | 1.4 | 5.8 | 300,000 | 120,000 |
Cold Stone Creamery | https://sharpsheets.io/blog/cold-stone-creamery-franchise-costs-profits/ | Ice Cream | 310,956 | 417,588 | 1.3 | 5.0 | 250,000 | 100,000 |
Jamba | https://sharpsheets.io/blog/jamba-franchise-costs-profits/ | Smoothie | 414,562 | 597,028 | 1.4 | 7.7 | 300,000 | 100,000 |
Church’s Chicken | https://sharpsheets.io/blog/churchs-texas-chicken-fees-sales-costs/ | Chicken | 1,195,147 | 1,395,088 | 1.2 | 5.7 | 1,000,000 | 300,000 |
Moe’s Southwest Grill | https://sharpsheets.io/blog/moes-southwest-grill-franchises-costs-profits/ | Mexican | 792,370 | 1,013,361 | 1.3 | 5.2 | 1,000,000 | 100,000 |
Tim Hortons | https://sharpsheets.io/blog/tim-hortons-franchises-costs-profits/ | Coffee | 1,242,750 | 1,188,240 | 1.0 | 7.0 | 500,000 | 100,000 |
Checkers & Rally's | https://sharpsheets.io/blog/checkers-franchises-profits-sales-costs/ | Burger | 837,847 | 1,039,773 | 1.2 | 5.4 | 750,000 | 250,000 |
Charleys Philly Steaks | https://sharpsheets.io/blog/charleys-philly-steaks-costs-profits/ | Sandwich | 509,806 | 786,233 | 1.5 | 4.3 | 500,000 | 100,000 |
Buffalo Wild Wings | https://sharpsheets.io/blog/buffalo-wild-wings-costs-profits/ | Chicken | 3,546,900 | 2,534,148 | 0.7 | 9.3 | 1,500,000 | 750,000 |
Rita's Ice | https://sharpsheets.io/blog/ritas-ice-franchise-costs-profits/ | Ice Cream | 215,839 | 248,340 | 1.2 | 5.8 | 300,000 | 100,000 |
A&W Restaurants | https://sharpsheets.io/blog/aw-restaurants-franchises-costs-profits/ | Burger | 786,750 | 851,212 | 1.1 | 6.2 | 350,000 | 150,000 |
Hungry Howie’s Pizza | https://sharpsheets.io/blog/hungry-howies-pizza-franchise-costs-profits/ | Pizza | 419,682 | 806,899 | 1.9 | 3.5 | 750,000 | 200,000 |
Bojangles | https://sharpsheets.io/blog/bojangles-franchise-costs-profits/ | Chicken | 1,658,000 | 1,801,057 | 1.1 | 6.1 | 1,000,000 | 500,000 |
McAlister’s Deli | https://sharpsheets.io/blog/mcalister-deli-franchise-costs-profits/ | Sandwich | 1,424,963 | 1,865,861 | 1.3 | 5.1 | 1,000,000 | 500,000 |
Round Table Pizza | https://sharpsheets.io/blog/round-table-pizza-franchise-costs-profits/ | Pizza | 783,250 | 1,037,816 | 1.3 | 5.0 | 500,000 | 200,000 |
Qdoba Mexican Eats | https://sharpsheets.io/blog/qdoba-mexican-eats-franchise-costs-profits/ | Mexican | 659,250 | 972,962 | 1.5 | 4.5 | ||
Freddy’s | https://sharpsheets.io/blog/freddys-franchise-costs-profits/ | Burger | 1,453,040 | 1,792,929 | 1.2 | 5.4 | 1,000,000 | 400,000 |
Taco John’s | https://sharpsheets.io/blog/taco-johns-franchise-costs-profits/ | Mexican | 1,119,000 | 1,124,980 | 1.0 | 6.6 | 1,000,000 | 400,000 |
Scooter’s Coffee | https://sharpsheets.io/blog/scooters-coffee-franchise-costs-profits/ | Coffee | 1,143,250 | 797,101 | 0.7 | 9.6 | 500,000 | 200,000 |
Einstein Bros. Bagels | https://sharpsheets.io/blog/einstein-bros-bagels-franchise-costs-profits/ | Sandwich | 750,075 | 885,011 | 1.2 | 5.7 | 1,000,000 | 536,500 |
Great American Cookies | https://sharpsheets.io/blog/great-american-cookies-franchise-costs-profits/ | Sweets | 385,275 | 452,771 | 1.2 | 5.7 | 250,000 | 100,000 |
Wienerschnitzel | https://sharpsheets.io/blog/wienerschnitzel-franchise-costs-profits/ | Hot dogs | 873,300 | 880,980 | 1.0 | 6.6 | 600,000 | 250,000 |
Blaze Pizza | https://sharpsheets.io/blog/blaze-pizza-franchise-costs-profits/ | Pizza | 865,450 | 1,096,432 | 1.3 | 7.9 | 500,000 | 300,000 |
Wetzel's Pretzels | https://sharpsheets.io/blog/wetzels-pretzels-franchise-costs-profits/ | Pretzels | 377,571 | 748,857 | 2.0 | 3.4 | 300,000 | 50,000 |
Pizza Ranch | https://sharpsheets.io/blog/pizza-ranch-franchise-costs-profits/ | Pizza | 3,268,300 | 1,174,088 | 0.4 | 18.6 | 1,000,000 | 297,000 |
Del Taco | https://sharpsheets.io/blog/del-taco-franchise-costs-profits/ | Mexican | 1,406,850 | 1,345,341 | 1.0 | 7.0 | 2,000,000 | 500,000 |
Schlotzsky’s | https://sharpsheets.io/blog/schlotzskys-franchises-costs-profits/ | Healthy, Salads | 1,102,933 | 1,053,333 | 0.3 | 22.2 | 1,000,000 | 300,000 |
Captain D’s | https://sharpsheets.io/blog/captain-ds-franchise-profits-costs/ | Seafood | 982,778 | 1,067,816 | 0.4 | 19.0 | 1,000,000 | 350,000 |
Biggby Coffee | https://sharpsheets.io/blog/biggby-coffee-franchise-profits-costs/ | Coffee | 310,575 | 648,352 | 0.3 | 20.0 | 300,000 | 100,000 |
Which Wich | https://sharpsheets.io/blog/which-wich-franchises-profits-costs/ | Sandwich | 330,375 | 281,886 | 0.3 | 22.2 | 500,000 | 150,000 |
Marble Slab Creamery | https://sharpsheets.io/blog/marble-slab-franchises-costs-profits/ | Ice Cream | 407,360 | 251,052 | 0.4 | 16.7 | 250,000 | 100,000 |
Mountain Mike's Pizza | https://sharpsheets.io/blog/mountain-mikes-franchise-profits-costs/ | Pizza | 410,900 | 865,713 | 0.3 | 20.0 | 300,000 | 100,000 |
Huddle House | https://sharpsheets.io/blog/huddle-house-franchise-cost-profits/ | Diner | 988,743 | 712,428 | 0.5 | 13.3 | 600,000 | 300,000 |
L&L Hawaiian Barbecue | https://sharpsheets.io/blog/ll-hawaiian-barbecue-franchises-costs-profits/ | BBQ | 334,350 | 612,921 | 0.3 | 33.3 | 500,000 | 150,000 |
Chicken Salad Chick | https://sharpsheets.io/blog/chicken-salad-chick-franchises-costs-profits/ | Healthy, Salads | 651,000 | 1,202,020 | 0.3 | 20.0 | 750,000 | 250,000 |
Golden Chick | https://sharpsheets.io/blog/golden-chick-franchises-costs-profits/ | Chicken | 362,975 | 917,609 | 2.5 | 2.6 | 2,000,000 | 425,000 |
Perkins | https://sharpsheets.io/blog/perkins-franchise-costs-profits/ | Diner | 1,922,728 | 1,729,246 | 0.9 | 7.4 | 1,500,000 | 500,000 |
Waba Grill | https://sharpsheets.io/blog/waba-grill-franchises-costs-profits/ | Teryaki | 454,000 | 466,536 | 1.0 | 6.5 | 1,000,000 | 250,000 |
Bruster’s Ice Cream | https://sharpsheets.io/blog/brusters-franchises-profits-costs/ | Ice Cream | 663,925 | 466,696 | 0.7 | 9.5 | 375,000 | 150,000 |