
Captain D’s Franchise FDD, Profits & Costs

Captain D’s is a well-established seafood restaurant chain that began its journey as Mr. D’s Seafood and Hamburgers in Donelson, Tennessee, on August 15, 1969.
The restaurant quickly gained popularity for its commitment to providing quality seafood at reasonable prices, a concept that was innovative at the time.
In 1974, the company rebranded to Captain D’s Seafood to focus more on its core offerings of fish, shrimp, and various side dishes, which have since become customer favorites.
Headquartered in Nashville, Tennessee, Captain D’s has grown significantly over the years. It now boasts over 500 locations across 23 states, with a mix of corporate and franchise-owned restaurants.
The franchise began expanding its reach in the early 1970s and has continued to develop new locations, adapting its restaurant prototypes to fit various site configurations, from traditional setups to end-caps and other non-traditional sites.
Captain D’s differentiates itself from the competition by focusing on freshly prepared seafood, using high-quality ingredients to ensure a premium dining experience.
Their menu features classic hand-battered fish fillets, a variety of fried and grilled seafood, chicken, and an assortment of Southern-style side dishes such as coleslaw, hush puppies, and baked potatoes.

Initial Investment
How much does it cost to start a Captain D’s franchise? It costs on average between $899,000 – $1,354,000 to start a Captain D’s franchised restaurant.
This includes costs for construction, equipment, inventory, and initial operating expenses. The exact amount depends on various factors, including the type of restaurant you choose, the location, and whether the franchisee chooses to lease or purchase the property. Captain D’s offers 4 types of franchises:
| Franchise Option | Initial Investment |
|---|---|
| Captain D’s 44-seat Prototype | $1,159,500 to $1,354,200 |
| Captain D’s 32-seat Prototype | $1,037,300 to $1,252,270 |
| Captain D’s Express Prototype | $898,600 to $1,091,700 |
| Captain D’s Inline or Endcap | $898,600 to $1,091,700 |
We are summarizing below the main costs associated with opening a Captain D’s 44-seat Prototype.
For more information on the various types of franchises and its costs, refer to the Franchise Disclosure Document (Item 7).
| Type of Expenditure | Amount |
|---|---|
| Franchise Fee | $35,000 |
| Real Estate | Not specified |
| Building and Leasehold Improvements | $750,000 to $815,000 |
| Training Expenses | $25,000 to $46,000 |
| Equipment | $256,500 to $292,100 |
| Computer Systems | $31,000 to $34,100 |
| Inventory | $6,000 to $8,000 |
| Miscellaneous Opening Expenses | $5,000 to $9,000 |
| Insurance | $11,000 to $25,000 |
| Additional Funds – 3 Months | $40,000 to $90,000 |
| Total | $1,159,500 to $1,354,200 |
Average Revenue (AUV)
How much revenue can you make with a Captain D’s franchise? A Captain D’s franchised restaurant makes on average $1,017,000 in revenue (AUV) per year.
Here is the extract from the Franchise Disclosure Document:
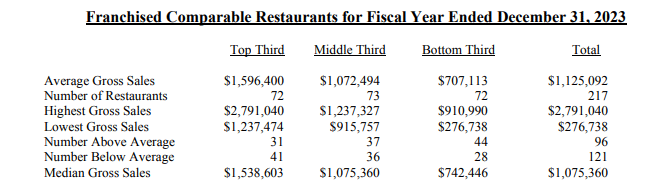
This compares to $1,113,000 yearly revenue for similar other food & beverage franchises.
Captain D’s Franchise Disclosure Document
Frequently Asked Questions
How much can a Captain D’s franchise owner expect to earn?
The average gross sales for a Captain D’s franchise are approximately $1.02 million per location. Assuming a 15% operating profit margin, $1.02 million yearly revenue can result in $153,000 EBITDA annually.
What funding options are available for a Captain D’s franchise?
Most franchise buyers in Captain D’s’s investment range finance their unit through an SBA 7(a) loan, with some multi-unit operators using SBA 504 loans for real estate. Buyers with rollable retirement funds sometimes use a ROBS structure to reduce debt service. See SharpSheets’ financial model hub for funding guidance.
How long does it take to pay back a Captain D’s franchise investment?
Payback periods for franchises in Captain D’s’s category typically run 3-7 years, depending on investment level, location performance, and financing structure. Actual payback varies significantly by unit performance and debt service obligations.
Who owns Captain D’s?
Captain D’s is owned by Sentinel Capital Partners, a private equity firm. Sentinel acquired Captain D’s in 2017. The firm specializes in buying and managing companies in various industries, including franchising and restaurants. Under their ownership, Captain D’s has continued to expand and strengthen its presence in the fast-casual seafood segment.
SharpSheets Editorial Team | sharpsheets.io | Last Updated: June 2026
Disclaimer
Disclaimer: This content has been made for informational and educational purposes only. SharpSheets is an independent educational resource and is not affiliated with, endorsed by, or representing any franchisor mentioned on this website. Where noted, figures are taken from the franchisor’s Franchise Disclosure Document (FDD). In some cases, we may provide independent calculations or estimates based on publicly available information. We do not make any representation or warranties with respect to the accuracy, applicability, fitness, or completeness of the information presented in the article. You should not construe any such information or other material as legal, tax, investment, financial, or other professional advice. Nothing contained in this article constitutes a solicitation, recommendation, endorsement, advertisement, or offer to buy or sell any franchises, securities, or other financial instruments in this or in any other jurisdiction in which such solicitation or offer would be unlawful under the franchise and/or securities laws of such jurisdiction.
All content in this article is information of a general nature and does not address the detailed circumstances of any particular individual or entity. Nothing in the article constitutes professional and/or financial and/or legal advice, nor does any information in the article constitute a comprehensive or complete statement of the matters discussed or the law relating thereto. You alone assume the sole responsibility of evaluating the merits and risks associated with the use of any information or other content in this article before making any decisions based on such information or other content.
Research Captain Dss Costs franchise data: For the full FDD cost breakdown, investment tables, and Item 19 disclosures, visit FranchisePayback.com → Captain Dss Costs FDD Review.


