Charley’s Philly Steaks Franchises Costs & Profits (2023)
A popular cheesesteak restaurant franchise, Charley’s Philly Steaks has grown and now has over 700 location in 17 countries worldwide. Charley’s Philly Steaks is also quite popular among franchisees and for a good reason: it would take you on average (only) 4 years to reimburse your investment to open a new Charley’s Philly Steaks restaurant.
Indeed, you would need to invest $509,806 on average. In comparison, the average Charley’s Philly Steaks franchise makes $786,233 in sales per year.
In this article, we’re looking at Charley’s Philly Steaks and the information provided in its Franchise Disclosure Document. More importantly, we’ll see how much you can really make with this business, and whether you should own a Charley’s Philly Steaks franchise. Let’s dive in!
Key stats
Franchise fee | $24,500 |
Royalty fee | 6.0% |
Marketing fee | 5.0% |
Investment (mid-point) | $510,000 |
Average sales | $786,000 |
Sales to investment ratio | 1.5x |
Payback period | 4 years |
Minimum net worth | $500,000 |
Minimum liquid capital | $100,000 |
What is Charley’s Philly Steaks?
Charleys Philly Steaks, formerly Charley’s Grilled Subs and Charley’s Steaks, is an American restaurant chain headquartered in Columbus, Ohio.
The brand’s story began in 1985, at Ohio State University, as a simple 450-square-foot restaurant satisfying the college students’ appetite for made-to-order cheesesteaks, lemonade, and gourmet fries.
Charley Shin founded the restaurant chain after tasting the Philly cheesesteak for the first time and falling in love with it.
The chain is famous for its tasty cheesesteaks, soft drinks, fruit lemonades, and French fries. In addition, select stores serve frozen shakes, fried appetizers, and boneless wings.
Charley Philly Steaks began its franchising operations in 1991, long before it became a subsidiary of Gosh Enterprises, another Shin-owned company. Currently, the chain has 700 locations spread across 46 US states and in 17 other countries around the world.
Charley’s Philly Steaks franchise: pros and cons
Pros
- Reduced rent costs: Charleys Philly Steaks stands out because of its small footprint. New restaurants require limited space, reducing rental costs.
- Growth opportunities: the franchisor offers room for expansion in several markets. There’s always an opportunity to start a thriving franchise in airports, strip centers, army bases, and retail shopping centers.
- Comprehensive training: the initial training session runs for 3 weeks. This includes food safety, cost control, inventory control, basic management techniques, and food preparation. In total, franchisees must complete 90 hours of on-the-job training and 60 hours of classroom learning as part of the Franchise Agreement.
- A standout menu: Charleys Philly Steaks has a unique menu that revolves around the cheesesteak. This stands out in a niche dominated by the chicken, burger, and pizza trio
- Third-party financing: Charleys Philly Steaks partners with the relevant third-party sources to cover the startup costs, franchise fees, cost of equipment, receivables, accounts, and inventory.
- Marketing support: the franchisor provides a wealth of marketing and promotional tools to support new restaurant owners. It helps with market planning and support, SEO, creating ad templates, regional advertising, email marketing, social media management, and website development.
- Ongoing support: the brand’s continued support makes it easier for franchisees to operate their businesses. It includes newsletters, field operations, proprietary software, lease negotiation, and site selection.
Cons
- No exclusive territory: the Franchise Agreement does not include exclusive territorial control. Franchisees must be ready to compete with similar businesses within the selected location.
- No absentee ownership: to open a Charley Philly Steaks franchise, you must get involved in the day-to-day operations.
- Minimum of 20 employees: the franchisor has a mandatory employee requirement to start and operate the business.
- Franchisees can’t operate from home: to run a full-service Charleys Philly Steaks franchise, you must have an office or retail facility.
- Can’t be run part-time: new restaurant owners can only run their franchises full-time, long-term.
How much does a Charley’s Philly Steaks cost?
You would invest around $509,806 to open a Charley’s Philly Steaks restaurant.
This number is an average. Indeed, it changes based on the type of restaurant you go for. For example, you need to invest more for a freestanding location vs. a Walmart restaurant.
Restaurant format | Low | Average | High |
---|---|---|---|
CPS* restaurants | $242,137 | $455,069 | $668,000 |
CPSW** restaurants | $269,524 | $636,112 | $1,002,700 |
Walmart location | $292,775 | $438,238 | $583,700 |
All restaurants | $509,806 |
** operating in inline and freestanding locations
Source: 2022 Franchise Disclosure Document
Including the initial franchise fee of $24,500, you would need to pay for building costs, leasehold improvements, working capital for the first 3 months of operation, etc. Here’s the full breakdown:
Type of cost | Low | High |
---|---|---|
Initial franchise fee | $24,500 | $24,500 |
Leasehold improvements | $100,000 | $339,000 |
Equipment, furniture | $60,931 | $145,000 |
POS system | $5,206 | $15,500 |
Real estate lease | $12,500 | $50,000 |
Grand opening marketing | $7,000 | $10,000 |
Additional funds* | $20,000 | $30,000 |
Other expenses | $21,500 | $54,000 |
Total | $251,637 | $668,000 |
How much can you make with a Charley’s Philly Steaks franchise?
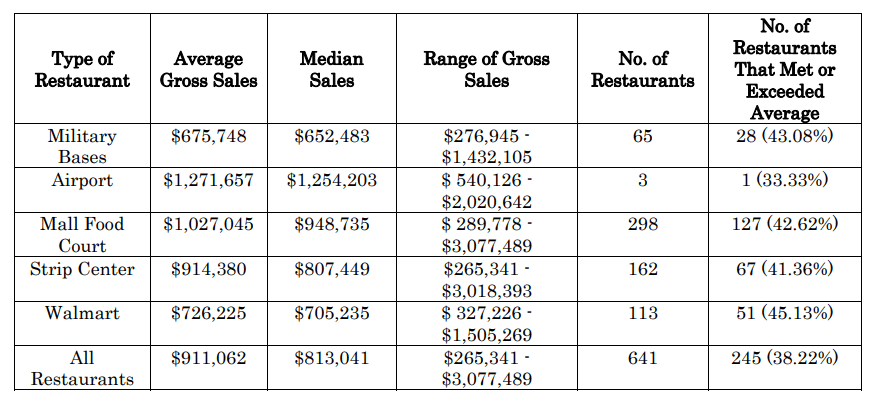
On average, a Charleys Philly Steaks franchise generates $786,233 turnover per year.
This number is the annual median sales for all 477 restaurants operating in 2021. As such, it includes all types of locations: military bases, airports, strip centers, etc. See the full breakdown below.
Location | Number of restaurants | Median sales |
---|---|---|
Military bases | 79 | $486,961 |
Airports | 3 | $570,000 |
Mall food courts | 339 | $856,693 |
Strip centers | 56 | $818,143 |
All locations | 477 | $786,233 |
How profitable is a Charley’s Philly Steaks franchise?
On average, a Charleys Philly Steaks franchise makes $212,283 in profits per year. This represents a 27% adjusted EBITDA margin.
Can you keep 27% of your revenue as net profit? No, this adjusted EBITDA does not mean that the full 27% of the total revenue goes to your pockets. Rather, you may need to deduct taxes, debt interest expenses, and other costs.
The good news is that the 27% adjusted EBITDA margin is in line compared to similar franchises as per our analysis (~25-27% industry average).
Do keep in mind though that Charleys Philly Steaks doesn’t provide any costs for its franchised restaurants. Instead, we had to use industry averages for COGS (25% sales), labor (29%), and rent costs (8%) to calculate profits.
Profit-and-loss | Amount ($) | As % of sales |
---|---|---|
Sales | $786,233 | 100% |
COGS | $(196,558) | 25.0%* |
Labor | $(228,008) | 29.0%* |
Rent | $(62,899) | 8.0%* |
Royalty + marketing fees | $(86,486) | 11.0% |
Adjusted EBITDA | $212,283 | ~27% |
Is a Charley’s Philly Steaks franchise a good investment?
If you’re considering opening a new Charley’s Philly Steaks then you’re in luck. As per our analysis, it’s a great investment: you would reimburse your investment on average within 4 to 5 years.
How did we come up with that? We compared the average upfront investment of $509,806 you must pay for as the franchisee to the expected profits (for that, we used a 15% net profit margin, which makes sense given adjusted EBITDA is ~27%).
Download our business plan template below and access your 5-year financial projections as well as insights and reports like your breakeven point, payback period, return on investment and more.
How does it compare vs. other franchises?
Franchise | Investment ($) | Sales ($) | Payback (years) | Min. net worth ($) | Min. liquid capital ($) | |||
---|---|---|---|---|---|---|---|---|
Chick-Fil-A | https://sharpsheets.io/blog/chick-fil-a-franchise-costs-profits/ | Chicken | 1,363,510 | 4,227,417 | 3.1 | 2.2 | - | - |
Dunkin' Donuts | https://sharpsheets.io/blog/dunkin-donuts-franchise-costs-profits/ | Donuts | 779,000 | 1,056,521 | 1.4 | 4.9 | 500,000 | 250,000 |
Domino's | https://sharpsheets.io/blog/dominos-franchise-profits-costs/ | Pizza | 398,725 | 1,286,428 | 3.2 | 3.9 | 250,000 | 75,000 |
Krispy Kreme | https://sharpsheets.io/blog/krispy-kreme-franchise-costs-profits/ | Donuts | 824,000 | 3,400,000 | 4.1 | 1.6 | 2,000,000 | 300,000 |
Little Caesars | https://sharpsheets.io/blog/little-caesars-franchise-costs-profits/ | Pizza | 1,022,850 | 798,113 | 0.8 | 8.5 | 350,000 | 150,000 |
Wingstop | https://sharpsheets.io/blog/wingstop-franchise-costs-profits/ | Chicken | 631,695 | 1,460,459 | 2.3 | 2.9 | 1,200,000 | 600,000 |
Steak 'n Shake | https://sharpsheets.io/blog/steak-n-shake-franchise-costs-profits/ | Burger, Milshakes | 815,626 | 1,346,332 | 1.7 | 4.0 | 1,500,000 | 500,000 |
Crumbl Cookies | https://sharpsheets.io/blog/crumbl-cookie-franchise-cost-profits/ | Sweets | 507,224 | 1,582,090 | 3.1 | 2.1 | 300,000 | 150,000 |
Taco Bell | https://sharpsheets.io/blog/taco-bell-franchise-costs-profits/ | Mexican | 462,413 | 1,650,000 | 3.6 | 1.9 | 1,500,000 | 750,000 |
Popeyes | https://sharpsheets.io/blog/popeyes-franchise-costs-profits/ | Chicken | 1,095,783 | 1,444,617 | 1.3 | 5.1 | 1,000,000 | 500,000 |
Smoothie King | https://sharpsheets.io/blog/smoothie-king-franchise-costs-profits/ | Smoothie | 688,108 | 573,269 | 0.8 | 8.0 | 300,000 | 100,000 |
Jersey Mike's | https://sharpsheets.io/blog/jersey-mikes-franchise-costs-profits/ | Sandwich | 574,323 | 1,220,586 | 2.1 | 4.7 | 300,000 | 100,000 |
Nothing Bundt Cakes | https://sharpsheets.io/blog/nothing-bundt-cakes-franchise-costs-profits/ | Sweets | 538,650 | 1,307,280 | 2.4 | 2.7 | 600,000 | 150,000 |
Jimmy John's | https://sharpsheets.io/blog/jimmy-johns-franchise-costs-profits/ | Sandwich | 513,650 | 874,845 | 1.7 | 3.9 | 300,000 | 80,000 |
Texas Roadhouse | https://sharpsheets.io/blog/texas-roadhouse-franchise-costs-profits/ | Steakhouse | 4,209,500 | 2,955,534 | 0.7 | 9.5 | n.a. | 200,000 |
Kung Fu Tea | https://sharpsheets.io/blog/kung-fu-tea-franchise-costs-profits/ | Bubble tea | 250,125 | 353,237 | 1.4 | 4.7 | n.a. | 25,000 |
Wendy’s | https://sharpsheets.io/blog/wendys-franchise-cost-profits/ | Burger | 1,374,833 | 1,791,231 | 1.3 | 5.1 | 1,000,000 | 500,000 |
Burger King | https://sharpsheets.io/blog/burger-king-franchise-costs-profits/ | Burger | 1,242,950 | 1,215,970 | 1.0 | 6.8 | 1,500,000 | 500,000 |
Sonic Drive-In | https://sharpsheets.io/blog/sonic-drive-in-franchise-costs-profits/ | Burger | 1,467,083 | 1,617,000 | 1.1 | 6.0 | 1,000,000 | 500,000 |
Panera Bread | https://sharpsheets.io/blog/panera-bread-franchise-costs-profits/ | Sandwich | 2,290,500 | 2,599,432 | 1.1 | 5.9 | 7,500,000 | 3,000,000 |
Pizza Hut | https://sharpsheets.io/blog/pizza-hut-franchise-costs-profits/ | Pizza | 935,575 | 906,911 | 1.0 | 6.9 | 700,000 | 350,000 |
KFC | https://sharpsheets.io/blog/kfc-franchise-costs-profits/ | Chicken | 1,802,050 | 1,567,474 | 0.9 | 7.7 | 1,500,000 | 750,000 |
Arby’s | https://sharpsheets.io/blog/arbys-franchise-costs-profits/ | Sandwich | 1,184,975 | 1,126,263 | 1.0 | 7.0 | 1,000,000 | 500,000 |
Dairy Queen | https://sharpsheets.io/blog/dairy-queen-franchise-costs-profits/ | Ice Cream | 1,404,220 | 1,143,180 | 0.8 | 8.2 | 750,000 | 400,000 |
Jack in the Box | https://sharpsheets.io/blog/jack-in-the-box-franchise-costs-profits/ | Burger | 2,195,800 | 1,755,503 | 0.8 | 12.5 | 1,000,000 | 250,000 |
Papa John’s | https://sharpsheets.io/blog/papa-johns-franchise-costs-profits/ | Pizza | 353,695 | 1,101,127 | 3.1 | 2.1 | 750,000 | 250,000 |
Zaxby’s | https://sharpsheets.io/blog/zaxbys-franchise-costs-profits/ | Chicken | 534,750 | 2,229,187 | 4.2 | 2.4 | 1,000,000 | 500,000 |
Hardee’s | https://sharpsheets.io/blog/hardees-franchise-costs-profits/ | Burger | 1,759,000 | 1,147,975 | 0.7 | 10.2 | 1,000,000 | 300,000 |
Culver’s | https://sharpsheets.io/blog/culvers-franchise-costs-profits/ | Burger | 4,044,500 | 3,051,762 | 0.8 | 8.8 | 2,000,000 | 350,000 |
Five Guys | https://sharpsheets.io/blog/five-guys-franchise-costs-profits/ | Burger | 511,225 | 1,203,366 | 2.4 | 2.8 | 500,000 | 250,000 |
Carl’s Jr. | https://sharpsheets.io/blog/carls-jr-franchise-costs-profits/ | Burger | 1,860,335 | 1,419,516 | 0.8 | 8.7 | 1,000,000 | 500,000 |
Baskin-Robbins | https://sharpsheets.io/blog/baskin-robbins-franchise-costs-profits/ | Ice Cream | 465,100 | 316,815 | 0.7 | 9.8 | 250,000 | 125,000 |
IHOP | https://sharpsheets.io/blog/ihop-franchise-costs-profits/ | Pancakes | 2,058,302 | 1,553,311 | 0.8 | 8.8 | 1,500,000 | 500,000 |
Applebee’s | https://sharpsheets.io/blog/applebees-franchise-costs-profits/ | Casual American | 5,137,966 | 2,356,965 | 0.5 | 14.5 | 1,000,000 | 500,000 |
Denny's | https://sharpsheets.io/blog/dennys-franchise-costs-profits/ | Casual American | 3,785,459 | 1,639,549 | 0.4 | 15.4 | 1,000,000 | 500,000 |
Papa Murphy's | https://sharpsheets.io/blog/papa-murphys-franchise-costs-profits/ | Pizza | 433,174 | 580,441 | 1.3 | 5.0 | 275,000 | 125,000 |
Auntie Anne's | https://sharpsheets.io/blog/auntie-annes-franchise-costs-profits/ | Pretzels | 229,692 | 343,135 | 1.5 | 5.6 | 300,000 | 100,000 |
Firehouse Subs | https://sharpsheets.io/blog/firehouse-subs-franchise-costs-profits/ | Sandwich | 613,186 | 888,356 | 1.4 | 4.6 | 350,000 | 100,000 |
Tropical Smoothie Cafe | https://sharpsheets.io/blog/tropical-smoothie-cafe-franchise-costs-profits/ | Smoothie | 430,500 | 961,969 | 2.2 | 3.0 | 350,000 | 125,000 |
Marco’s Pizza | https://sharpsheets.io/blog/marcos-pizza-franchises-costs-profits/ | Pizza | 437,625 | 895,523 | 2.0 | 3.3 | 400,000 | 100,000 |
Cinnabon | https://sharpsheets.io/blog/cinnabon-franchises-costs-profits/ | Sweets | 276,062 | 394,897 | 1.4 | 5.8 | 300,000 | 120,000 |
Cold Stone Creamery | https://sharpsheets.io/blog/cold-stone-creamery-franchise-costs-profits/ | Ice Cream | 310,956 | 417,588 | 1.3 | 5.0 | 250,000 | 100,000 |
Jamba | https://sharpsheets.io/blog/jamba-franchise-costs-profits/ | Smoothie | 414,562 | 597,028 | 1.4 | 7.7 | 300,000 | 100,000 |
Church’s Chicken | https://sharpsheets.io/blog/churchs-texas-chicken-fees-sales-costs/ | Chicken | 1,195,147 | 1,395,088 | 1.2 | 5.7 | 1,000,000 | 300,000 |
Moe’s Southwest Grill | https://sharpsheets.io/blog/moes-southwest-grill-franchises-costs-profits/ | Mexican | 792,370 | 1,013,361 | 1.3 | 5.2 | 1,000,000 | 100,000 |
Tim Hortons | https://sharpsheets.io/blog/tim-hortons-franchises-costs-profits/ | Coffee | 1,242,750 | 1,188,240 | 1.0 | 7.0 | 500,000 | 100,000 |
Checkers & Rally's | https://sharpsheets.io/blog/checkers-franchises-profits-sales-costs/ | Burger | 837,847 | 1,039,773 | 1.2 | 5.4 | 750,000 | 250,000 |
Charleys Philly Steaks | https://sharpsheets.io/blog/charleys-philly-steaks-costs-profits/ | Sandwich | 509,806 | 786,233 | 1.5 | 4.3 | 500,000 | 100,000 |
Buffalo Wild Wings | https://sharpsheets.io/blog/buffalo-wild-wings-costs-profits/ | Chicken | 3,546,900 | 2,534,148 | 0.7 | 9.3 | 1,500,000 | 750,000 |
Rita's Ice | https://sharpsheets.io/blog/ritas-ice-franchise-costs-profits/ | Ice Cream | 215,839 | 248,340 | 1.2 | 5.8 | 300,000 | 100,000 |
A&W Restaurants | https://sharpsheets.io/blog/aw-restaurants-franchises-costs-profits/ | Burger | 786,750 | 851,212 | 1.1 | 6.2 | 350,000 | 150,000 |
Hungry Howie’s Pizza | https://sharpsheets.io/blog/hungry-howies-pizza-franchise-costs-profits/ | Pizza | 419,682 | 806,899 | 1.9 | 3.5 | 750,000 | 200,000 |
Bojangles | https://sharpsheets.io/blog/bojangles-franchise-costs-profits/ | Chicken | 1,658,000 | 1,801,057 | 1.1 | 6.1 | 1,000,000 | 500,000 |
McAlister’s Deli | https://sharpsheets.io/blog/mcalister-deli-franchise-costs-profits/ | Sandwich | 1,424,963 | 1,865,861 | 1.3 | 5.1 | 1,000,000 | 500,000 |
Round Table Pizza | https://sharpsheets.io/blog/round-table-pizza-franchise-costs-profits/ | Pizza | 783,250 | 1,037,816 | 1.3 | 5.0 | 500,000 | 200,000 |
Qdoba Mexican Eats | https://sharpsheets.io/blog/qdoba-mexican-eats-franchise-costs-profits/ | Mexican | 659,250 | 972,962 | 1.5 | 4.5 | ||
Freddy’s | https://sharpsheets.io/blog/freddys-franchise-costs-profits/ | Burger | 1,453,040 | 1,792,929 | 1.2 | 5.4 | 1,000,000 | 400,000 |
Taco John’s | https://sharpsheets.io/blog/taco-johns-franchise-costs-profits/ | Mexican | 1,119,000 | 1,124,980 | 1.0 | 6.6 | 1,000,000 | 400,000 |
Scooter’s Coffee | https://sharpsheets.io/blog/scooters-coffee-franchise-costs-profits/ | Coffee | 1,143,250 | 797,101 | 0.7 | 9.6 | 500,000 | 200,000 |
Einstein Bros. Bagels | https://sharpsheets.io/blog/einstein-bros-bagels-franchise-costs-profits/ | Sandwich | 750,075 | 885,011 | 1.2 | 5.7 | 1,000,000 | 536,500 |
Great American Cookies | https://sharpsheets.io/blog/great-american-cookies-franchise-costs-profits/ | Sweets | 385,275 | 452,771 | 1.2 | 5.7 | 250,000 | 100,000 |
Wienerschnitzel | https://sharpsheets.io/blog/wienerschnitzel-franchise-costs-profits/ | Hot dogs | 873,300 | 880,980 | 1.0 | 6.6 | 600,000 | 250,000 |
Blaze Pizza | https://sharpsheets.io/blog/blaze-pizza-franchise-costs-profits/ | Pizza | 865,450 | 1,096,432 | 1.3 | 7.9 | 500,000 | 300,000 |
Wetzel's Pretzels | https://sharpsheets.io/blog/wetzels-pretzels-franchise-costs-profits/ | Pretzels | 377,571 | 748,857 | 2.0 | 3.4 | 300,000 | 50,000 |
Pizza Ranch | https://sharpsheets.io/blog/pizza-ranch-franchise-costs-profits/ | Pizza | 3,268,300 | 1,174,088 | 0.4 | 18.6 | 1,000,000 | 297,000 |
Del Taco | https://sharpsheets.io/blog/del-taco-franchise-costs-profits/ | Mexican | 1,406,850 | 1,345,341 | 1.0 | 7.0 | 2,000,000 | 500,000 |
Schlotzsky’s | https://sharpsheets.io/blog/schlotzskys-franchises-costs-profits/ | Healthy, Salads | 1,102,933 | 1,053,333 | 0.3 | 22.2 | 1,000,000 | 300,000 |
Captain D’s | https://sharpsheets.io/blog/captain-ds-franchise-profits-costs/ | Seafood | 982,778 | 1,067,816 | 0.4 | 19.0 | 1,000,000 | 350,000 |
Biggby Coffee | https://sharpsheets.io/blog/biggby-coffee-franchise-profits-costs/ | Coffee | 310,575 | 648,352 | 0.3 | 20.0 | 300,000 | 100,000 |
Which Wich | https://sharpsheets.io/blog/which-wich-franchises-profits-costs/ | Sandwich | 330,375 | 281,886 | 0.3 | 22.2 | 500,000 | 150,000 |
Marble Slab Creamery | https://sharpsheets.io/blog/marble-slab-franchises-costs-profits/ | Ice Cream | 407,360 | 251,052 | 0.4 | 16.7 | 250,000 | 100,000 |
Mountain Mike's Pizza | https://sharpsheets.io/blog/mountain-mikes-franchise-profits-costs/ | Pizza | 410,900 | 865,713 | 0.3 | 20.0 | 300,000 | 100,000 |
Huddle House | https://sharpsheets.io/blog/huddle-house-franchise-cost-profits/ | Diner | 988,743 | 712,428 | 0.5 | 13.3 | 600,000 | 300,000 |
L&L Hawaiian Barbecue | https://sharpsheets.io/blog/ll-hawaiian-barbecue-franchises-costs-profits/ | BBQ | 334,350 | 612,921 | 0.3 | 33.3 | 500,000 | 150,000 |
Chicken Salad Chick | https://sharpsheets.io/blog/chicken-salad-chick-franchises-costs-profits/ | Healthy, Salads | 651,000 | 1,202,020 | 0.3 | 20.0 | 750,000 | 250,000 |
Golden Chick | https://sharpsheets.io/blog/golden-chick-franchises-costs-profits/ | Chicken | 362,975 | 917,609 | 2.5 | 2.6 | 2,000,000 | 425,000 |
Perkins | https://sharpsheets.io/blog/perkins-franchise-costs-profits/ | Diner | 1,922,728 | 1,729,246 | 0.9 | 7.4 | 1,500,000 | 500,000 |
Waba Grill | https://sharpsheets.io/blog/waba-grill-franchises-costs-profits/ | Teryaki | 454,000 | 466,536 | 1.0 | 6.5 | 1,000,000 | 250,000 |
Bruster’s Ice Cream | https://sharpsheets.io/blog/brusters-franchises-profits-costs/ | Ice Cream | 663,925 | 466,696 | 0.7 | 9.5 | 375,000 | 150,000 |
Disclaimer: This content has been made for informational and educational purposes only. We do not make any representation or warranties with respect to the accuracy, applicability, fitness, or completeness of the information presented in the article. You should not construe any such information or other material as legal, tax, investment, financial, or other professional advice. Nothing contained in this article constitutes a solicitation, recommendation, endorsement, advertisement, or offer to buy or sell any franchises, securities, or other financial instruments in this or in any other jurisdiction in which such solicitation or offer would be unlawful under the franchise and/or securities laws of such jurisdiction.
All content in this article is information of a general nature and does not address the detailed circumstances of any particular individual or entity. Nothing in the article constitutes professional and/or financial and/or legal advice, nor does any information in the article constitute a comprehensive or complete statement of the matters discussed or the law relating thereto. You alone assume the sole responsibility of evaluating the merits and risks associated with the use of any information or other content in this article before making any decisions based on such information or other content.