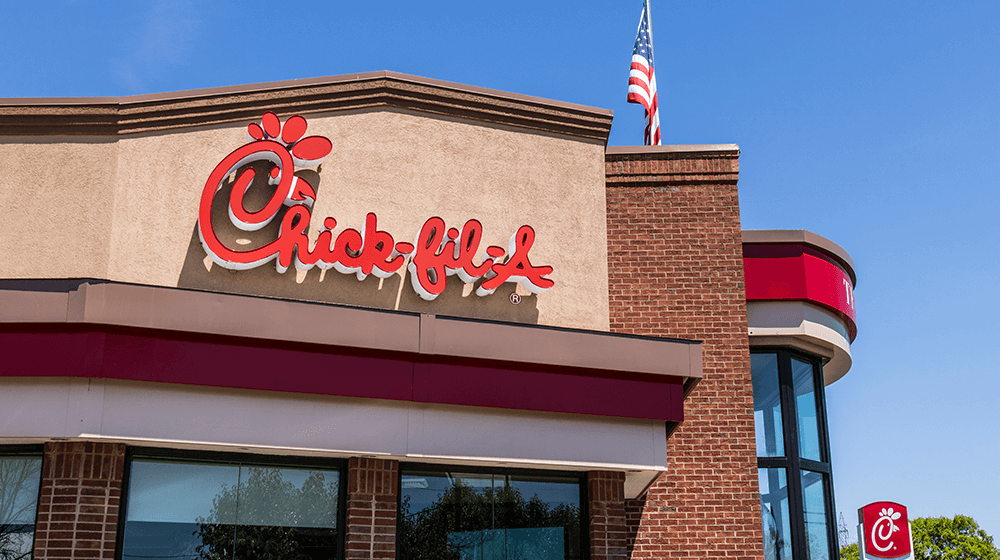
With 1,976 franchise restaurants across the US and Canada, yet one of the most difficult application process, you may wonder whether opening a Chick-Fil-A franchise is a good investment.
In this article we’ll look at the financials of Chick-Fil-A franchises by using the latest FDD numbers. We’ll look into questions like: how much sales you can expect to make, and more importantly, how profitable this franchise really is.
Chick-Fil-A franchise: key figures
Franchise fee | $10,000 |
Royalty fee | 15.0% |
Marketing fee | 3.25% |
Investment (mid-point) | $1,363,510 |
Average sales | $4,227,417 |
Sales to investment ratio | 3.1 |
Payback period* | 2.2 years (excellent) |
🔎 How does Chick-fil-A compare vs. other franchises? Check the ranking
Chick-Fil-A: a brief introduction
Chick-fil-A is an American fast food restaurant chain. It is one of the largest and the largest fast food restaurant chain specializing in chicken sandwiches. There are 2,873 restaurants operated by the brand, most of which are located in the United States.
Except for Alaska, Vermont, and Hawaii, Chick-fil-A operates in 47 US states and Washington D.C. Outside of America, the company has several restaurants operating in Canada.
Before Chick-fil-A came into existence, the founder S. Truett Cathy founded Dwarf House in 1946, which primarily focused on steaks and hamburgers. Today, there are 12 Dwarf House restaurants operational in the US. Chick-fil-A was founded in 1967 after Dwarf House became a success. The first Chick-fil-A restaurant was opened in Atlanta.
Apart from chicken sandwich, grilled nuggets are one of the most popular menu items of Chick-fil-A, and the company spent a whopping $50 million dollars and 7 years to perfect the recipe. Most of the money went into designing a special grill by Chick-fil-A scientists.
Chick-fil-A is a privately owned company, and it will never go public because of the last wish of the founder. Cathy actually signed a contract with his children which dictates that the chain will remain a private company, but his children have the freedom to sell off the company.
According to Zippia, Chick-fil-A has 35,574 employees and the company clocked a revenue of $11.3 billion in 2021.
Chick-Fil-A franchise: pros and cons
Chick-fil-A franchise comes with various advantages and disadvantages. Here is a quick rundown of the pros and cons you must be aware of:
Pros
- Offers development courses and multi-week training program to provide support to their franchisees
- Franchise fee is much lower than the competitors
- Chick-fil-A takes care of the startup costs such as real estate, construction, etc.
- The company will provide all equipment you will need to run your franchise efficiently
- You don’t need to have any prior restaurant experience
- You must keep the store closed on Sundays to maintain a proper work-life balance
Cons
- You cannot select the restaurant site. The company will do that for you. The company will not even entertain suggestions from you
- You cannot run multiple units (stores) at once
- The real estate and all property will be owned by Chick-fil-A, which means you cannot sell it and you cannot hand it over to your next generation
- You must be a hands-on-operator, which means, you cannot open a Chick-fil-A restaurant as a passive investor
- You cannot pursue other business ventures while running a Chick-fil-A franchise. You must give your full commitment
How much does it cost to open a Chick-Fil-A franchise?
The franchise fee you must pay to Chick-Fil-A to open a new franchise is quite low vs. other quick-service restaurants. Indeed, the franchise fee only costs $10,000 to the franchisee.
How much you need to invest?
The average amount you need to invest as the franchisee is $1,363,510, which also includes the initial franchise fee of $10,000.
Although, it is just an average, the amount can vary based on many reasons such as: location, size or type of the restaurant, etc. As per the latest FDD, the investment ranges from a minimum of $295,412 to a maximum of $2,431,608.
This investment amount reflects everything a business needs at the start. It is the sum of expenses like opening inventory, the first month’s rental of equipment, lease, insurance, and additional funds for operations to sustain losses the first few months.
Type of cost | Amount |
Initial Franchise Fee | $10,000 |
Formation costs | $1475 – $85,800 |
Operating expenses | $293,937 – $2,345,808 |
Total | $295,412 – $2,431,608 |
What is the turnover of a Chick-Fil-A franchise?
On average, a Chick-Fil-A franchise makes $4,227,417 in sales per year.
This number vary depending on whether the restaurant is located within a mall ($1,570,000) or not ($6,884,000). In other words, restaurants that aren’t located in a mall tend to have turnover 4x times higher vs. mall units.
Mall units | Non mall units | Total | |
---|---|---|---|
Revenue | $1,570,000 | $6,884,000 | $6,235,900 |
Restaurants | 241 | 1,735 | 1,976 |
How profitable is a Chick-Fil-A franchise?
Looking at the financial information provided in the latest FDD, Chick-Fil-A franchises have an adjusted EBITDA margin of 21%.
Please note this operating profit only includes COGS, labor, rent and royalty and marketing fees paid to the franchisor. To obtain this number, we used the royalty fees as well as the rent expense provided in the FDD.
Yet Chick-Fil-A doesn’t not provide COGS nor labor costs. Therefore we used industry average percentages for those 2 instead (actually we used MacDonalds’ COGS ratio or 25% and labor costs of 29%).
Now, using the average annual sales of $6,235,900, the average adjusted EBITDA is around $903,108 per year.
Profit-and-loss | Amount ($) | As % of sales |
---|---|---|
Sales | $4,227,417 | 100% |
COGS | $(1,056,854) | 25%** |
Labor | $(1,225,951) | 29%** |
Rent | $(270,000)* | |
Royalty fees | $(771,504) | 15% + 3.25% |
Adjusted EBITDA | $903,108 | ~21% |
Is a Chick-Fil-A franchise a good investment?
The profitability of a business doesn’t tell us much about whether it’s a good investment. Indeed, in order to know whether you should invest in a Chick-Fil-A franchise, you must compare the profits you earn vs. the investment cost you pay upfront (the payback period).
Payback period = Investment / Average annual net profit
We know that the average investment to open a Chick-Fil-A franchise is $1,363,510. Yet in comparison you earn around 15% net profit per year (industry average) ie. $634,000 per year.
The payback period for a Chick-Fil-A is only 2.2 years, which is exceptionally good for a franchise in general. In other words, it takes a franchisee 2.2 years to recoup her/his original investment.
So from this standpoint we can argue that Chick-Fil-A franchises are very good investments. Indeed, anything below 4 is excellent.
Of course, these numbers are averages, and your franchise payback period may be different based on various factors. In order to assess whether your franchise is a good investment, download our financial plan template below.
How does Chick-Fil-A compare vs. other franchises?
Franchise | Investment ($) | Sales ($) | S/I Ratio | Payback (years) | Min. net worth ($) | Min. liquid capital ($) | ||
---|---|---|---|---|---|---|---|---|
Chick-Fil-A | https://sharpsheets.io/blog/chick-fil-a-franchise-costs-profits/ | Chicken | 1,363,510 | 4,227,417 | 3.1 | 2.2 | - | - |
Dunkin' Donuts | https://sharpsheets.io/blog/dunkin-donuts-franchise-costs-profits/ | Donuts | 779,000 | 1,056,521 | 1.4 | 4.9 | 500,000 | 250,000 |
Domino's | https://sharpsheets.io/blog/dominos-franchise-profits-costs/ | Pizza | 398,725 | 1,286,428 | 3.2 | 3.9 | 250,000 | 75,000 |
Krispy Kreme | https://sharpsheets.io/blog/krispy-kreme-franchise-costs-profits/ | Donuts | 824,000 | 3,400,000 | 4.1 | 1.6 | 2,000,000 | 300,000 |
Little Caesars | https://sharpsheets.io/blog/little-caesars-franchise-costs-profits/ | Pizza | 1,022,850 | 798,113 | 0.8 | 8.5 | 350,000 | 150,000 |
Wingstop | https://sharpsheets.io/blog/wingstop-franchise-costs-profits/ | Chicken | 631,695 | 1,460,459 | 2.3 | 2.9 | 1,200,000 | 600,000 |
Steak 'n Shake | https://sharpsheets.io/blog/steak-n-shake-franchise-costs-profits/ | Burger, Milshakes | 815,626 | 1,346,332 | 1.7 | 4.0 | 1,500,000 | 500,000 |
Crumbl Cookies | https://sharpsheets.io/blog/crumbl-cookie-franchise-cost-profits/ | Sweets | 507,224 | 1,582,090 | 3.1 | 2.1 | 300,000 | 150,000 |
Taco Bell | https://sharpsheets.io/blog/taco-bell-franchise-costs-profits/ | Mexican | 462,413 | 1,650,000 | 3.6 | 1.9 | 1,500,000 | 750,000 |
Popeyes | https://sharpsheets.io/blog/popeyes-franchise-costs-profits/ | Chicken | 1,095,783 | 1,444,617 | 1.3 | 5.1 | 1,000,000 | 500,000 |
Smoothie King | https://sharpsheets.io/blog/smoothie-king-franchise-costs-profits/ | Smoothie | 688,108 | 573,269 | 0.8 | 8.0 | 300,000 | 100,000 |
Jersey Mike's | https://sharpsheets.io/blog/jersey-mikes-franchise-costs-profits/ | Sandwich | 574,323 | 1,220,586 | 2.1 | 4.7 | 300,000 | 100,000 |
Nothing Bundt Cakes | https://sharpsheets.io/blog/nothing-bundt-cakes-franchise-costs-profits/ | Sweets | 538,650 | 1,307,280 | 2.4 | 2.7 | 600,000 | 150,000 |
Jimmy John's | https://sharpsheets.io/blog/jimmy-johns-franchise-costs-profits/ | Sandwich | 513,650 | 874,845 | 1.7 | 3.9 | 300,000 | 80,000 |
Texas Roadhouse | https://sharpsheets.io/blog/texas-roadhouse-franchise-costs-profits/ | Steakhouse | 4,209,500 | 2,955,534 | 0.7 | 9.5 | n.a. | 200,000 |
Kung Fu Tea | https://sharpsheets.io/blog/kung-fu-tea-franchise-costs-profits/ | Bubble tea | 250,125 | 353,237 | 1.4 | 4.7 | n.a. | 25,000 |
Wendy’s | https://sharpsheets.io/blog/wendys-franchise-cost-profits/ | Burger | 1,374,833 | 1,791,231 | 1.3 | 5.1 | 1,000,000 | 500,000 |
Burger King | https://sharpsheets.io/blog/burger-king-franchise-costs-profits/ | Burger | 1,242,950 | 1,215,970 | 1.0 | 6.8 | 1,500,000 | 500,000 |
Sonic Drive-In | https://sharpsheets.io/blog/sonic-drive-in-franchise-costs-profits/ | Burger | 1,467,083 | 1,617,000 | 1.1 | 6.0 | 1,000,000 | 500,000 |
Panera Bread | https://sharpsheets.io/blog/panera-bread-franchise-costs-profits/ | Sandwich | 2,290,500 | 2,599,432 | 1.1 | 5.9 | 7,500,000 | 3,000,000 |
Pizza Hut | https://sharpsheets.io/blog/pizza-hut-franchise-costs-profits/ | Pizza | 935,575 | 906,911 | 1.0 | 6.9 | 700,000 | 350,000 |
KFC | https://sharpsheets.io/blog/kfc-franchise-costs-profits/ | Chicken | 1,802,050 | 1,567,474 | 0.9 | 7.7 | 1,500,000 | 750,000 |
Arby’s | https://sharpsheets.io/blog/arbys-franchise-costs-profits/ | Sandwich | 1,184,975 | 1,126,263 | 1.0 | 7.0 | 1,000,000 | 500,000 |
Dairy Queen | https://sharpsheets.io/blog/dairy-queen-franchise-costs-profits/ | Ice Cream | 1,404,220 | 1,143,180 | 0.8 | 8.2 | 750,000 | 400,000 |
Jack in the Box | https://sharpsheets.io/blog/jack-in-the-box-franchise-costs-profits/ | Burger | 2,195,800 | 1,755,503 | 0.8 | 12.5 | 1,000,000 | 250,000 |
Papa John’s | https://sharpsheets.io/blog/papa-johns-franchise-costs-profits/ | Pizza | 353,695 | 1,101,127 | 3.1 | 2.1 | 750,000 | 250,000 |
Zaxby’s | https://sharpsheets.io/blog/zaxbys-franchise-costs-profits/ | Chicken | 534,750 | 2,229,187 | 4.2 | 2.4 | 1,000,000 | 500,000 |
Hardee’s | https://sharpsheets.io/blog/hardees-franchise-costs-profits/ | Burger | 1,759,000 | 1,147,975 | 0.7 | 10.2 | 1,000,000 | 300,000 |
Culver’s | https://sharpsheets.io/blog/culvers-franchise-costs-profits/ | Burger | 4,044,500 | 3,051,762 | 0.8 | 8.8 | 2,000,000 | 350,000 |
Five Guys | https://sharpsheets.io/blog/five-guys-franchise-costs-profits/ | Burger | 511,225 | 1,203,366 | 2.4 | 2.8 | 500,000 | 250,000 |
Carl’s Jr. | https://sharpsheets.io/blog/carls-jr-franchise-costs-profits/ | Burger | 1,860,335 | 1,419,516 | 0.8 | 8.7 | 1,000,000 | 500,000 |
Baskin-Robbins | https://sharpsheets.io/blog/baskin-robbins-franchise-costs-profits/ | Ice Cream | 465,100 | 316,815 | 0.7 | 9.8 | 250,000 | 125,000 |
IHOP | https://sharpsheets.io/blog/ihop-franchise-costs-profits/ | Pancakes | 2,058,302 | 1,553,311 | 0.8 | 8.8 | 1,500,000 | 500,000 |
Applebee’s | https://sharpsheets.io/blog/applebees-franchise-costs-profits/ | Casual American | 5,137,966 | 2,356,965 | 0.5 | 14.5 | 1,000,000 | 500,000 |
Denny's | https://sharpsheets.io/blog/dennys-franchise-costs-profits/ | Casual American | 3,785,459 | 1,639,549 | 0.4 | 15.4 | 1,000,000 | 500,000 |
Papa Murphy's | https://sharpsheets.io/blog/papa-murphys-franchise-costs-profits/ | Pizza | 433,174 | 580,441 | 1.3 | 5.0 | 275,000 | 125,000 |
Auntie Anne's | https://sharpsheets.io/blog/auntie-annes-franchise-costs-profits/ | Pretzels | 229,692 | 343,135 | 1.5 | 5.6 | 300,000 | 100,000 |
Firehouse Subs | https://sharpsheets.io/blog/firehouse-subs-franchise-costs-profits/ | Sandwich | 613,186 | 888,356 | 1.4 | 4.6 | 350,000 | 100,000 |
Tropical Smoothie Cafe | https://sharpsheets.io/blog/tropical-smoothie-cafe-franchise-costs-profits/ | Smoothie | 430,500 | 961,969 | 2.2 | 3.0 | 350,000 | 125,000 |
Marco’s Pizza | https://sharpsheets.io/blog/marcos-pizza-franchises-costs-profits/ | Pizza | 437,625 | 895,523 | 2.0 | 3.3 | 400,000 | 100,000 |
Cinnabon | https://sharpsheets.io/blog/cinnabon-franchises-costs-profits/ | Sweets | 276,062 | 394,897 | 1.4 | 5.8 | 300,000 | 120,000 |
Cold Stone Creamery | https://sharpsheets.io/blog/cold-stone-creamery-franchise-costs-profits/ | Ice Cream | 310,956 | 417,588 | 1.3 | 5.0 | 250,000 | 100,000 |
Jamba | https://sharpsheets.io/blog/jamba-franchise-costs-profits/ | Smoothie | 414,562 | 597,028 | 1.4 | 7.7 | 300,000 | 100,000 |
Church’s Chicken | https://sharpsheets.io/blog/churchs-texas-chicken-fees-sales-costs/ | Chicken | 1,195,147 | 1,395,088 | 1.2 | 5.7 | 1,000,000 | 300,000 |
Moe’s Southwest Grill | https://sharpsheets.io/blog/moes-southwest-grill-franchises-costs-profits/ | Mexican | 792,370 | 1,013,361 | 1.3 | 5.2 | 1,000,000 | 100,000 |
Tim Hortons | https://sharpsheets.io/blog/tim-hortons-franchises-costs-profits/ | Coffee | 1,242,750 | 1,188,240 | 1.0 | 7.0 | 500,000 | 100,000 |
Checkers & Rally's | https://sharpsheets.io/blog/checkers-franchises-profits-sales-costs/ | Burger | 837,847 | 1,039,773 | 1.2 | 5.4 | 750,000 | 250,000 |
Charleys Philly Steaks | https://sharpsheets.io/blog/charleys-philly-steaks-costs-profits/ | Sandwich | 509,806 | 786,233 | 1.5 | 4.3 | 500,000 | 100,000 |
Buffalo Wild Wings | https://sharpsheets.io/blog/buffalo-wild-wings-costs-profits/ | Chicken | 3,546,900 | 2,534,148 | 0.7 | 9.3 | 1,500,000 | 750,000 |
Rita's Ice | https://sharpsheets.io/blog/ritas-ice-franchise-costs-profits/ | Ice Cream | 215,839 | 248,340 | 1.2 | 5.8 | 300,000 | 100,000 |
A&W Restaurants | https://sharpsheets.io/blog/aw-restaurants-franchises-costs-profits/ | Burger | 786,750 | 851,212 | 1.1 | 6.2 | 350,000 | 150,000 |
Hungry Howie’s Pizza | https://sharpsheets.io/blog/hungry-howies-pizza-franchise-costs-profits/ | Pizza | 419,682 | 806,899 | 1.9 | 3.5 | 750,000 | 200,000 |
Bojangles | https://sharpsheets.io/blog/bojangles-franchise-costs-profits/ | Chicken | 1,658,000 | 1,801,057 | 1.1 | 6.1 | 1,000,000 | 500,000 |
McAlister’s Deli | https://sharpsheets.io/blog/mcalister-deli-franchise-costs-profits/ | Sandwich | 1,424,963 | 1,865,861 | 1.3 | 5.1 | 1,000,000 | 500,000 |
Round Table Pizza | https://sharpsheets.io/blog/round-table-pizza-franchise-costs-profits/ | Pizza | 783,250 | 1,037,816 | 1.3 | 5.0 | 500,000 | 200,000 |
Qdoba Mexican Eats | https://sharpsheets.io/blog/qdoba-mexican-eats-franchise-costs-profits/ | Mexican | 659,250 | 972,962 | 1.5 | 4.5 | ||
Freddy’s | https://sharpsheets.io/blog/freddys-franchise-costs-profits/ | Burger | 1,453,040 | 1,792,929 | 1.2 | 5.4 | 1,000,000 | 400,000 |
Taco John’s | https://sharpsheets.io/blog/taco-johns-franchise-costs-profits/ | Mexican | 1,119,000 | 1,124,980 | 1.0 | 6.6 | 1,000,000 | 400,000 |
Scooter’s Coffee | https://sharpsheets.io/blog/scooters-coffee-franchise-costs-profits/ | Coffee | 1,143,250 | 797,101 | 0.7 | 9.6 | 500,000 | 200,000 |
Einstein Bros. Bagels | https://sharpsheets.io/blog/einstein-bros-bagels-franchise-costs-profits/ | Sandwich | 750,075 | 885,011 | 1.2 | 5.7 | 1,000,000 | 536,500 |
Great American Cookies | https://sharpsheets.io/blog/great-american-cookies-franchise-costs-profits/ | Sweets | 385,275 | 452,771 | 1.2 | 5.7 | 250,000 | 100,000 |
Wienerschnitzel | https://sharpsheets.io/blog/wienerschnitzel-franchise-costs-profits/ | Hot dogs | 873,300 | 880,980 | 1.0 | 6.6 | 600,000 | 250,000 |
Blaze Pizza | https://sharpsheets.io/blog/blaze-pizza-franchise-costs-profits/ | Pizza | 865,450 | 1,096,432 | 1.3 | 7.9 | 500,000 | 300,000 |
Wetzel's Pretzels | https://sharpsheets.io/blog/wetzels-pretzels-franchise-costs-profits/ | Pretzels | 377,571 | 748,857 | 2.0 | 3.4 | 300,000 | 50,000 |
Pizza Ranch | https://sharpsheets.io/blog/pizza-ranch-franchise-costs-profits/ | Pizza | 3,268,300 | 1,174,088 | 0.4 | 18.6 | 1,000,000 | 297,000 |
Del Taco | https://sharpsheets.io/blog/del-taco-franchise-costs-profits/ | Mexican | 1,406,850 | 1,345,341 | 1.0 | 7.0 | 2,000,000 | 500,000 |
Schlotzsky’s | https://sharpsheets.io/blog/schlotzskys-franchises-costs-profits/ | Healthy, Salads | 1,102,933 | 1,053,333 | 0.3 | 22.2 | 1,000,000 | 300,000 |
Captain D’s | https://sharpsheets.io/blog/captain-ds-franchise-profits-costs/ | Seafood | 982,778 | 1,067,816 | 0.4 | 19.0 | 1,000,000 | 350,000 |
Biggby Coffee | https://sharpsheets.io/blog/biggby-coffee-franchise-profits-costs/ | Coffee | 310,575 | 648,352 | 0.3 | 20.0 | 300,000 | 100,000 |
Which Wich | https://sharpsheets.io/blog/which-wich-franchises-profits-costs/ | Sandwich | 330,375 | 281,886 | 0.3 | 22.2 | 500,000 | 150,000 |
Marble Slab Creamery | https://sharpsheets.io/blog/marble-slab-franchises-costs-profits/ | Ice Cream | 407,360 | 251,052 | 0.4 | 16.7 | 250,000 | 100,000 |
Mountain Mike's Pizza | https://sharpsheets.io/blog/mountain-mikes-franchise-profits-costs/ | Pizza | 410,900 | 865,713 | 0.3 | 20.0 | 300,000 | 100,000 |
Huddle House | https://sharpsheets.io/blog/huddle-house-franchise-cost-profits/ | Diner | 988,743 | 712,428 | 0.5 | 13.3 | 600,000 | 300,000 |
L&L Hawaiian Barbecue | https://sharpsheets.io/blog/ll-hawaiian-barbecue-franchises-costs-profits/ | BBQ | 334,350 | 612,921 | 0.3 | 33.3 | 500,000 | 150,000 |
Chicken Salad Chick | https://sharpsheets.io/blog/chicken-salad-chick-franchises-costs-profits/ | Healthy, Salads | 651,000 | 1,202,020 | 0.3 | 20.0 | 750,000 | 250,000 |
Golden Chick | https://sharpsheets.io/blog/golden-chick-franchises-costs-profits/ | Chicken | 362,975 | 917,609 | 2.5 | 2.6 | 2,000,000 | 425,000 |
Perkins | https://sharpsheets.io/blog/perkins-franchise-costs-profits/ | Diner | 1,922,728 | 1,729,246 | 0.9 | 7.4 | 1,500,000 | 500,000 |
Waba Grill | https://sharpsheets.io/blog/waba-grill-franchises-costs-profits/ | Teryaki | 454,000 | 466,536 | 1.0 | 6.5 | 1,000,000 | 250,000 |
Bruster’s Ice Cream | https://sharpsheets.io/blog/brusters-franchises-profits-costs/ | Ice Cream | 663,925 | 466,696 | 0.7 | 9.5 | 375,000 | 150,000 |