Are you a donut business enthusiast or an entrepreneur looking for an opportunity in the donut industry? Or are you thinking of applying for the Dunkin’ Donuts franchise, but you don’t know where to begin?
Then you’re in the right place. In this guide, we give you a detailed analysis of what Dunkin’ Donuts is and what it takes to make money as a franchisee.
We’ll look into how much it costs to open and run a Dunkin’ Donuts franchise and how much you can make with this business. Finally we’ll look into how profitable this franchise really is. Let’s dive in!
Dunkin’ Donuts franchise: key figures
Franchise fee | $65,000 |
Royalty fee | 5.9% |
Marketing fee | 5.0% |
Investment (mid-point) | $1,157,300 |
Average sales | $1,056,521 |
Sales to investment ratio | 1.4x |
Payback period* | 4.9 years (good) |
Minimum net worth | $500,000 |
Minimum liquid capital | $250,000 |
🔎 How does Dunkin’ compare vs. other franchises? Check the ranking
Dunkin’ Donuts: a brief introduction
Dunkin’ Donuts (“Dunkin’”, “Dunkin’ Donuts” or “DD”), is one of the leading coffee and donut shop chains globally. Headquartered in Canton, Massachusetts, the brand offers over 70 doughnut varieties and cold coffee drinks, bagels, breakfast sandwiches, and other baked goods in over 12,000 locations globally.
It was originally founded by Bill Rosenberg in 1948 in Quincy, Massachusetts, then known as ‘Open Kettle’. In 1950, after deliberating with his executives, Bill renamed the store Dunkin’ Donuts. The flourishing eatery shop was selling donuts for 5 cents and coffee for 10 cents.
The Dunkin’ Donuts franchise was born in 1955 with its first franchise Quick Service Restaurant (QSR). Later renamed Dunkin’ Donuts Franchising LLC, the franchisor company develops, operates, and franchises retail restaurants utilizing the Dunkin’ system.
Later, the brand changed to Dunkin’ in 2019 reflecting its growth and increasing emphasis on coffee and other drinks as well as sandwiches. Today, the Dunkin’ brand has more than 12,000 franchise stores in the US and over 42 countries.
Dunkin’ Donuts franchise: pros and cons
Despite being a successful and profitable chain store, Dunkin’ has its share of pros and cons, just like any other business.
The Pros
The Dunkin’ Donuts franchise has some of the most amazing benefits you’ll ever get from a donut franchise such as:
- Quality support team: at your disposal, you will have a team of experienced and qualified professionals ready to help your franchise prosper (real estate professionals, field marketing managers, and operations managers). They provide new franchisees with site selection information, and marketing and management information to help them scale their sales.
- Recognized brand: Dunkin’ brand is well recognized in the US and worldwide. And with 98% brand recognition among consumers, the Dunkin’ brand is fast-moving. As a new franchisee, you have the advantage of selling to customers who understand your brand and what you offer. The better part is that Dunkin’, in a move to keep its brand strong, continues to market itself by partnering with global partners like Coca-Cola, JetBlue, and Saucony.
- Plenty of available markets: Dunkin’ Donuts started its operations in the Northeast with much of its royal support found there. However, with time, it has grown to many restaurants found in the East. The brand continues to expand and plans to have over 1000 new stores in the US alone.
- Proven business model: For more than 70 years now, the Dunkin’ brand has been in business. This gives them an upper hand in understanding the industry they operate in. They have mastered what works and how to operate for their business to succeed.
- Franchisor’s solid financials: The franchisor Dunkin’ annual profits surpass the $1 billion mark, and the company is very profitable in its industry. What’s more is that new franchises can also break even in a relatively short period of time (see more on that later)
The Cons
Even with a basketful of advantages, running a Dunkin’ Donuts franchise has its share of drawbacks:
- A rigorous application process: As lucrative as the Dunkin’ Donuts franchise might look, applying and being accepted might not be easy. First, there are financial thresholds you must meet. To qualify as a DD franchise, you must have a net worth of $500,000 as well as meet the initial cost of $250,000
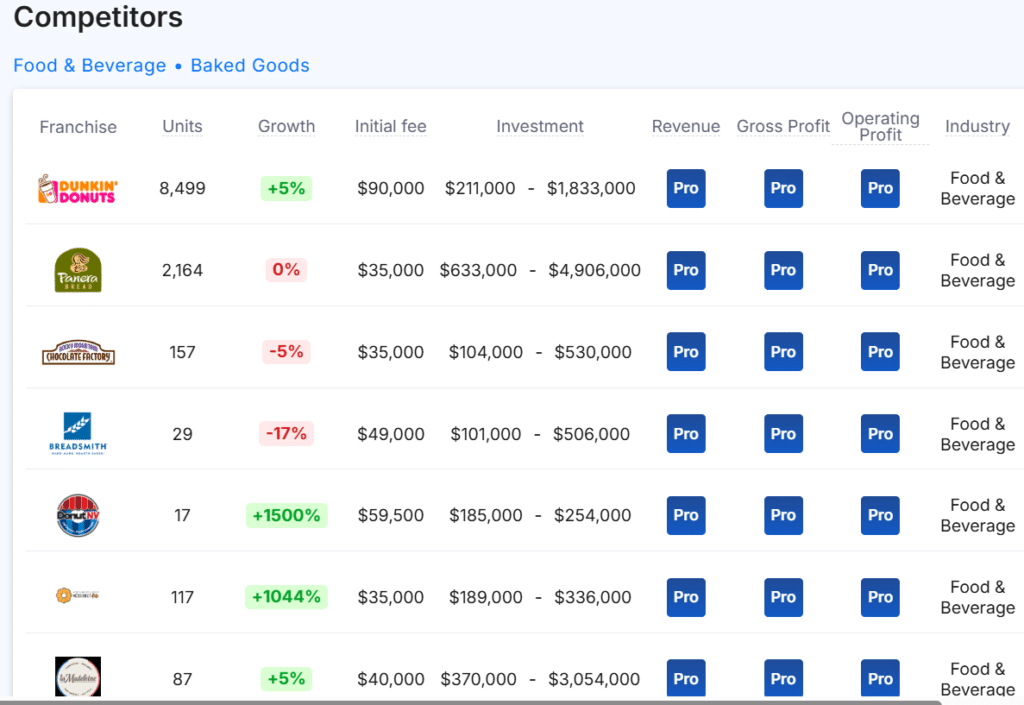
- Stiff competition: Another challenge that Dunkin’ franchise faces today is competition. With fast food demands, many popular multinationals occupy the space. To name a few: Starbucks, Tim Hortons, Krispy Kreme, etc. This can create pressure on prices and profits in the long run
How much does it cost to open a Dunkin’ Donuts franchise?
In order to open a Dunkin’ Donuts franchise, you will need to pay a franchise fee between $40,000 to $90,000. This is on the higher side for quick-service restaurants (McDonalds for example has a $65,000 franchise fee).
The franchise fee isn’t the only reason why prospective franchisees can be reluctant to open a Dunkin’ Donuts franchise. Indeed, in addition to the $40,000+ franchise fee, you will need to invest a substantial amount as well.
Whilst the investment can of course come from your own pocket, but also investors or a SBA loan, you will need to show you have $250,000 in liquid assets as well as a net worth of $500,000 minimum per restaurant.
How much you need to invest?
Including the franchise fee, you must invest a total of $526,900 to $1,787,700.
This amount should cover both build costs (site development, equipment, etc.) as well as operating expenses (travel, opening inventory, runway for the first 3 months of operations, etc.). Here’s a summary of the different costs you should pay for:
Type of restaurant | Investment amount |
---|---|
Initial Franchise Fee | $40,000 to $90,000 |
Build costs | $91,400 to $742,500 |
Operating expenses | $20,000 to $189,300 |
Total | $526,900 to $1,787,700 |
The investment amount also depends on the type of restaurants you intend to open.
For example, you would invest significantly more for a freestanding vs. a gas & convenience restaurant. Here’s the full list:
Type of restaurant | Investment amount |
---|---|
Freestanding | $526,900 to $1,787,700 |
Shopping Center / Storefront | $437,500 to $1,174,700 |
Gas & Convenience | $211,700 to $1,017,800 |
What is the turnover of a Dunkin’ Donuts franchise?
On average, a Dunkin’ Donuts franchise makes $1,056,521 in sales per year.
This amount represents the average median sales of all kinds of restaurants. It can change based on the type of restaurant or the restaurant’s location; for example, a drive-thru restaurant makes more revenue than a non-drive-thru restaurant.
Types of Restaurant | Median sales | Drive-Thru | Non Drive-Thru |
Freestanding | $1,205,059 | $1,420,783 | $989,336 |
Shopping Center / Storefront: | $1,014,434 | $1,256,377 | $772,491 |
Gas & Convenience Restaurants | $844,525 | $1,084,135 | $604,915 |
Non-traditional Outlets | $1,162,067 | $1,162,067 | – |
Average | $1,056,521 | $940,324 | $882,202 |
How profitable is a Dunkin’ Donuts franchise?
Dunkin’ Donuts franchises are very profitable businesses. Looking at the public information provided in the FDD, operating profit (after COGS, labor, rent and royalty fees) stand at 29% of sales, which is higher vs. the average profits for a quick-service restaurant.
Using the average annual turnover of $1,198,000, the average Dunkin’ Donuts makes about $351,000 in operating profit per year.
Of course, this doesn’t include any other expenses such as depreciation, other operating expenses, taxes and interest. Therefore, net profit margin would logically be lower. Unfortunately, there is no such data in the FDD.
Profit-and-loss | Amount ($) | As % of sales |
---|---|---|
Sales | $1,056,521 | 100% |
COGS | $(267,300) | 25.3% |
Labor | $(258,848) | 24.5% |
Rent | $(105,652) | 10.0%* |
Royalty fees | $(115,161) | 10.9% |
Operating profit | $309,561 | ~29% |
Is a Dunkin’ Donuts franchise a good investment?
Now that we know Dunkin’ Donuts franchises have adjusted EBITDA margin of about 29%, it doesn’t tell us 2 things: what’s their net profit margin (after all expenses have been paid for) and whether they are good investment from a financial standpoint.
As per our analysis, Dunkin’ Donuts have net profit margins of about 15%, in line with the industry. This means that the average Dunkin’ Donuts franchisee earns $158,000 in profits per year.
Now that we know how much you can make with this business, we must compare profits to the investment cost to figure out whether a Dunkin’ Donuts franchise is a good investment. This is what we call the payback period: how many years it takes for a franchisee to recoup her/his investment.
We know that the average investment for a Dunkin’ Donuts is $1,157,300. Therefore, the payback period is about 4.9 years which is a good number. Indeed, anything below 4 is excellent, around 5-6 years is good, and above 7 years is mediocre.
In other words, it means that you will need to wait 4.9 years to recoup your original investment of $1.2 million, only from that point in time you will make profits.
Of course, this is an average, and the payback period of your franchise may be different based on a number of factors. In other to know whether you should invest in a Dunkin’ Donuts franchise, download our financial plan and customise it with your assumptions.
How does Dunkin’ compare to other franchises?
Franchise | Investment ($) | Sales ($) | S/I Ratio | Payback (years) | Min. net worth ($) | Min. liquid capital ($) | ||
---|---|---|---|---|---|---|---|---|
Chick-Fil-A | https://sharpsheets.io/blog/chick-fil-a-franchise-costs-profits/ | Chicken | 1,363,510 | 4,227,417 | 3.1 | 2.2 | - | - |
Dunkin' Donuts | https://sharpsheets.io/blog/dunkin-donuts-franchise-costs-profits/ | Donuts | 779,000 | 1,056,521 | 1.4 | 4.9 | 500,000 | 250,000 |
Domino's | https://sharpsheets.io/blog/dominos-franchise-profits-costs/ | Pizza | 398,725 | 1,286,428 | 3.2 | 3.9 | 250,000 | 75,000 |
Krispy Kreme | https://sharpsheets.io/blog/krispy-kreme-franchise-costs-profits/ | Donuts | 824,000 | 3,400,000 | 4.1 | 1.6 | 2,000,000 | 300,000 |
Little Caesars | https://sharpsheets.io/blog/little-caesars-franchise-costs-profits/ | Pizza | 1,022,850 | 798,113 | 0.8 | 8.5 | 350,000 | 150,000 |
Wingstop | https://sharpsheets.io/blog/wingstop-franchise-costs-profits/ | Chicken | 631,695 | 1,460,459 | 2.3 | 2.9 | 1,200,000 | 600,000 |
Steak 'n Shake | https://sharpsheets.io/blog/steak-n-shake-franchise-costs-profits/ | Burger, Milshakes | 815,626 | 1,346,332 | 1.7 | 4.0 | 1,500,000 | 500,000 |
Crumbl Cookies | https://sharpsheets.io/blog/crumbl-cookie-franchise-cost-profits/ | Sweets | 507,224 | 1,582,090 | 3.1 | 2.1 | 300,000 | 150,000 |
Taco Bell | https://sharpsheets.io/blog/taco-bell-franchise-costs-profits/ | Mexican | 462,413 | 1,650,000 | 3.6 | 1.9 | 1,500,000 | 750,000 |
Popeyes | https://sharpsheets.io/blog/popeyes-franchise-costs-profits/ | Chicken | 1,095,783 | 1,444,617 | 1.3 | 5.1 | 1,000,000 | 500,000 |
Smoothie King | https://sharpsheets.io/blog/smoothie-king-franchise-costs-profits/ | Smoothie | 688,108 | 573,269 | 0.8 | 8.0 | 300,000 | 100,000 |
Jersey Mike's | https://sharpsheets.io/blog/jersey-mikes-franchise-costs-profits/ | Sandwich | 574,323 | 1,220,586 | 2.1 | 4.7 | 300,000 | 100,000 |
Nothing Bundt Cakes | https://sharpsheets.io/blog/nothing-bundt-cakes-franchise-costs-profits/ | Sweets | 538,650 | 1,307,280 | 2.4 | 2.7 | 600,000 | 150,000 |
Jimmy John's | https://sharpsheets.io/blog/jimmy-johns-franchise-costs-profits/ | Sandwich | 513,650 | 874,845 | 1.7 | 3.9 | 300,000 | 80,000 |
Texas Roadhouse | https://sharpsheets.io/blog/texas-roadhouse-franchise-costs-profits/ | Steakhouse | 4,209,500 | 2,955,534 | 0.7 | 9.5 | n.a. | 200,000 |
Kung Fu Tea | https://sharpsheets.io/blog/kung-fu-tea-franchise-costs-profits/ | Bubble tea | 250,125 | 353,237 | 1.4 | 4.7 | n.a. | 25,000 |
Wendy’s | https://sharpsheets.io/blog/wendys-franchise-cost-profits/ | Burger | 1,374,833 | 1,791,231 | 1.3 | 5.1 | 1,000,000 | 500,000 |
Burger King | https://sharpsheets.io/blog/burger-king-franchise-costs-profits/ | Burger | 1,242,950 | 1,215,970 | 1.0 | 6.8 | 1,500,000 | 500,000 |
Sonic Drive-In | https://sharpsheets.io/blog/sonic-drive-in-franchise-costs-profits/ | Burger | 1,467,083 | 1,617,000 | 1.1 | 6.0 | 1,000,000 | 500,000 |
Panera Bread | https://sharpsheets.io/blog/panera-bread-franchise-costs-profits/ | Sandwich | 2,290,500 | 2,599,432 | 1.1 | 5.9 | 7,500,000 | 3,000,000 |
Pizza Hut | https://sharpsheets.io/blog/pizza-hut-franchise-costs-profits/ | Pizza | 935,575 | 906,911 | 1.0 | 6.9 | 700,000 | 350,000 |
KFC | https://sharpsheets.io/blog/kfc-franchise-costs-profits/ | Chicken | 1,802,050 | 1,567,474 | 0.9 | 7.7 | 1,500,000 | 750,000 |
Arby’s | https://sharpsheets.io/blog/arbys-franchise-costs-profits/ | Sandwich | 1,184,975 | 1,126,263 | 1.0 | 7.0 | 1,000,000 | 500,000 |
Dairy Queen | https://sharpsheets.io/blog/dairy-queen-franchise-costs-profits/ | Ice Cream | 1,404,220 | 1,143,180 | 0.8 | 8.2 | 750,000 | 400,000 |
Jack in the Box | https://sharpsheets.io/blog/jack-in-the-box-franchise-costs-profits/ | Burger | 2,195,800 | 1,755,503 | 0.8 | 12.5 | 1,000,000 | 250,000 |
Papa John’s | https://sharpsheets.io/blog/papa-johns-franchise-costs-profits/ | Pizza | 353,695 | 1,101,127 | 3.1 | 2.1 | 750,000 | 250,000 |
Zaxby’s | https://sharpsheets.io/blog/zaxbys-franchise-costs-profits/ | Chicken | 534,750 | 2,229,187 | 4.2 | 2.4 | 1,000,000 | 500,000 |
Hardee’s | https://sharpsheets.io/blog/hardees-franchise-costs-profits/ | Burger | 1,759,000 | 1,147,975 | 0.7 | 10.2 | 1,000,000 | 300,000 |
Culver’s | https://sharpsheets.io/blog/culvers-franchise-costs-profits/ | Burger | 4,044,500 | 3,051,762 | 0.8 | 8.8 | 2,000,000 | 350,000 |
Five Guys | https://sharpsheets.io/blog/five-guys-franchise-costs-profits/ | Burger | 511,225 | 1,203,366 | 2.4 | 2.8 | 500,000 | 250,000 |
Carl’s Jr. | https://sharpsheets.io/blog/carls-jr-franchise-costs-profits/ | Burger | 1,860,335 | 1,419,516 | 0.8 | 8.7 | 1,000,000 | 500,000 |
Baskin-Robbins | https://sharpsheets.io/blog/baskin-robbins-franchise-costs-profits/ | Ice Cream | 465,100 | 316,815 | 0.7 | 9.8 | 250,000 | 125,000 |
IHOP | https://sharpsheets.io/blog/ihop-franchise-costs-profits/ | Pancakes | 2,058,302 | 1,553,311 | 0.8 | 8.8 | 1,500,000 | 500,000 |
Applebee’s | https://sharpsheets.io/blog/applebees-franchise-costs-profits/ | Casual American | 5,137,966 | 2,356,965 | 0.5 | 14.5 | 1,000,000 | 500,000 |
Denny's | https://sharpsheets.io/blog/dennys-franchise-costs-profits/ | Casual American | 3,785,459 | 1,639,549 | 0.4 | 15.4 | 1,000,000 | 500,000 |
Papa Murphy's | https://sharpsheets.io/blog/papa-murphys-franchise-costs-profits/ | Pizza | 433,174 | 580,441 | 1.3 | 5.0 | 275,000 | 125,000 |
Auntie Anne's | https://sharpsheets.io/blog/auntie-annes-franchise-costs-profits/ | Pretzels | 229,692 | 343,135 | 1.5 | 5.6 | 300,000 | 100,000 |
Firehouse Subs | https://sharpsheets.io/blog/firehouse-subs-franchise-costs-profits/ | Sandwich | 613,186 | 888,356 | 1.4 | 4.6 | 350,000 | 100,000 |
Tropical Smoothie Cafe | https://sharpsheets.io/blog/tropical-smoothie-cafe-franchise-costs-profits/ | Smoothie | 430,500 | 961,969 | 2.2 | 3.0 | 350,000 | 125,000 |
Marco’s Pizza | https://sharpsheets.io/blog/marcos-pizza-franchises-costs-profits/ | Pizza | 437,625 | 895,523 | 2.0 | 3.3 | 400,000 | 100,000 |
Cinnabon | https://sharpsheets.io/blog/cinnabon-franchises-costs-profits/ | Sweets | 276,062 | 394,897 | 1.4 | 5.8 | 300,000 | 120,000 |
Cold Stone Creamery | https://sharpsheets.io/blog/cold-stone-creamery-franchise-costs-profits/ | Ice Cream | 310,956 | 417,588 | 1.3 | 5.0 | 250,000 | 100,000 |
Jamba | https://sharpsheets.io/blog/jamba-franchise-costs-profits/ | Smoothie | 414,562 | 597,028 | 1.4 | 7.7 | 300,000 | 100,000 |
Church’s Chicken | https://sharpsheets.io/blog/churchs-texas-chicken-fees-sales-costs/ | Chicken | 1,195,147 | 1,395,088 | 1.2 | 5.7 | 1,000,000 | 300,000 |
Moe’s Southwest Grill | https://sharpsheets.io/blog/moes-southwest-grill-franchises-costs-profits/ | Mexican | 792,370 | 1,013,361 | 1.3 | 5.2 | 1,000,000 | 100,000 |
Tim Hortons | https://sharpsheets.io/blog/tim-hortons-franchises-costs-profits/ | Coffee | 1,242,750 | 1,188,240 | 1.0 | 7.0 | 500,000 | 100,000 |
Checkers & Rally's | https://sharpsheets.io/blog/checkers-franchises-profits-sales-costs/ | Burger | 837,847 | 1,039,773 | 1.2 | 5.4 | 750,000 | 250,000 |
Charleys Philly Steaks | https://sharpsheets.io/blog/charleys-philly-steaks-costs-profits/ | Sandwich | 509,806 | 786,233 | 1.5 | 4.3 | 500,000 | 100,000 |
Buffalo Wild Wings | https://sharpsheets.io/blog/buffalo-wild-wings-costs-profits/ | Chicken | 3,546,900 | 2,534,148 | 0.7 | 9.3 | 1,500,000 | 750,000 |
Rita's Ice | https://sharpsheets.io/blog/ritas-ice-franchise-costs-profits/ | Ice Cream | 215,839 | 248,340 | 1.2 | 5.8 | 300,000 | 100,000 |
A&W Restaurants | https://sharpsheets.io/blog/aw-restaurants-franchises-costs-profits/ | Burger | 786,750 | 851,212 | 1.1 | 6.2 | 350,000 | 150,000 |
Hungry Howie’s Pizza | https://sharpsheets.io/blog/hungry-howies-pizza-franchise-costs-profits/ | Pizza | 419,682 | 806,899 | 1.9 | 3.5 | 750,000 | 200,000 |
Bojangles | https://sharpsheets.io/blog/bojangles-franchise-costs-profits/ | Chicken | 1,658,000 | 1,801,057 | 1.1 | 6.1 | 1,000,000 | 500,000 |
McAlister’s Deli | https://sharpsheets.io/blog/mcalister-deli-franchise-costs-profits/ | Sandwich | 1,424,963 | 1,865,861 | 1.3 | 5.1 | 1,000,000 | 500,000 |
Round Table Pizza | https://sharpsheets.io/blog/round-table-pizza-franchise-costs-profits/ | Pizza | 783,250 | 1,037,816 | 1.3 | 5.0 | 500,000 | 200,000 |
Qdoba Mexican Eats | https://sharpsheets.io/blog/qdoba-mexican-eats-franchise-costs-profits/ | Mexican | 659,250 | 972,962 | 1.5 | 4.5 | ||
Freddy’s | https://sharpsheets.io/blog/freddys-franchise-costs-profits/ | Burger | 1,453,040 | 1,792,929 | 1.2 | 5.4 | 1,000,000 | 400,000 |
Taco John’s | https://sharpsheets.io/blog/taco-johns-franchise-costs-profits/ | Mexican | 1,119,000 | 1,124,980 | 1.0 | 6.6 | 1,000,000 | 400,000 |
Scooter’s Coffee | https://sharpsheets.io/blog/scooters-coffee-franchise-costs-profits/ | Coffee | 1,143,250 | 797,101 | 0.7 | 9.6 | 500,000 | 200,000 |
Einstein Bros. Bagels | https://sharpsheets.io/blog/einstein-bros-bagels-franchise-costs-profits/ | Sandwich | 750,075 | 885,011 | 1.2 | 5.7 | 1,000,000 | 536,500 |
Great American Cookies | https://sharpsheets.io/blog/great-american-cookies-franchise-costs-profits/ | Sweets | 385,275 | 452,771 | 1.2 | 5.7 | 250,000 | 100,000 |
Wienerschnitzel | https://sharpsheets.io/blog/wienerschnitzel-franchise-costs-profits/ | Hot dogs | 873,300 | 880,980 | 1.0 | 6.6 | 600,000 | 250,000 |
Blaze Pizza | https://sharpsheets.io/blog/blaze-pizza-franchise-costs-profits/ | Pizza | 865,450 | 1,096,432 | 1.3 | 7.9 | 500,000 | 300,000 |
Wetzel's Pretzels | https://sharpsheets.io/blog/wetzels-pretzels-franchise-costs-profits/ | Pretzels | 377,571 | 748,857 | 2.0 | 3.4 | 300,000 | 50,000 |
Pizza Ranch | https://sharpsheets.io/blog/pizza-ranch-franchise-costs-profits/ | Pizza | 3,268,300 | 1,174,088 | 0.4 | 18.6 | 1,000,000 | 297,000 |
Del Taco | https://sharpsheets.io/blog/del-taco-franchise-costs-profits/ | Mexican | 1,406,850 | 1,345,341 | 1.0 | 7.0 | 2,000,000 | 500,000 |
Schlotzsky’s | https://sharpsheets.io/blog/schlotzskys-franchises-costs-profits/ | Healthy, Salads | 1,102,933 | 1,053,333 | 0.3 | 22.2 | 1,000,000 | 300,000 |
Captain D’s | https://sharpsheets.io/blog/captain-ds-franchise-profits-costs/ | Seafood | 982,778 | 1,067,816 | 0.4 | 19.0 | 1,000,000 | 350,000 |
Biggby Coffee | https://sharpsheets.io/blog/biggby-coffee-franchise-profits-costs/ | Coffee | 310,575 | 648,352 | 0.3 | 20.0 | 300,000 | 100,000 |
Which Wich | https://sharpsheets.io/blog/which-wich-franchises-profits-costs/ | Sandwich | 330,375 | 281,886 | 0.3 | 22.2 | 500,000 | 150,000 |
Marble Slab Creamery | https://sharpsheets.io/blog/marble-slab-franchises-costs-profits/ | Ice Cream | 407,360 | 251,052 | 0.4 | 16.7 | 250,000 | 100,000 |
Mountain Mike's Pizza | https://sharpsheets.io/blog/mountain-mikes-franchise-profits-costs/ | Pizza | 410,900 | 865,713 | 0.3 | 20.0 | 300,000 | 100,000 |
Huddle House | https://sharpsheets.io/blog/huddle-house-franchise-cost-profits/ | Diner | 988,743 | 712,428 | 0.5 | 13.3 | 600,000 | 300,000 |
L&L Hawaiian Barbecue | https://sharpsheets.io/blog/ll-hawaiian-barbecue-franchises-costs-profits/ | BBQ | 334,350 | 612,921 | 0.3 | 33.3 | 500,000 | 150,000 |
Chicken Salad Chick | https://sharpsheets.io/blog/chicken-salad-chick-franchises-costs-profits/ | Healthy, Salads | 651,000 | 1,202,020 | 0.3 | 20.0 | 750,000 | 250,000 |
Golden Chick | https://sharpsheets.io/blog/golden-chick-franchises-costs-profits/ | Chicken | 362,975 | 917,609 | 2.5 | 2.6 | 2,000,000 | 425,000 |
Perkins | https://sharpsheets.io/blog/perkins-franchise-costs-profits/ | Diner | 1,922,728 | 1,729,246 | 0.9 | 7.4 | 1,500,000 | 500,000 |
Waba Grill | https://sharpsheets.io/blog/waba-grill-franchises-costs-profits/ | Teryaki | 454,000 | 466,536 | 1.0 | 6.5 | 1,000,000 | 250,000 |
Bruster’s Ice Cream | https://sharpsheets.io/blog/brusters-franchises-profits-costs/ | Ice Cream | 663,925 | 466,696 | 0.7 | 9.5 | 375,000 | 150,000 |