Freddy’s Franchise Franchise FDD, Profits & Costs (2025)
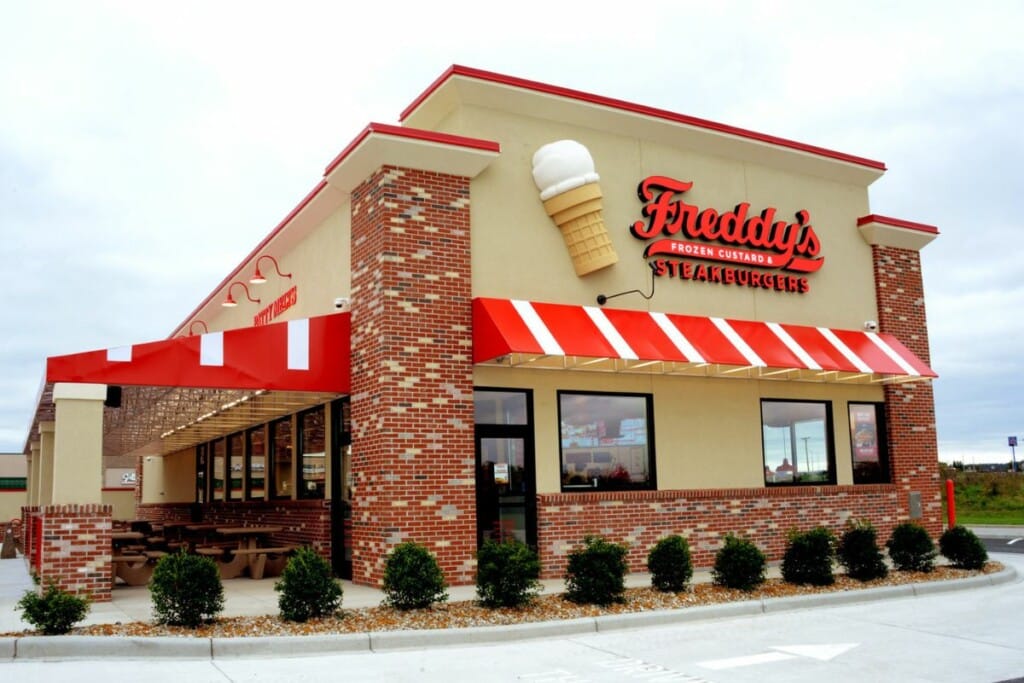
Freddy’s Frozen Custard & Steakburgers was founded in 2002 in Wichita, Kansas, by brothers Bill and Randy Simon, along with their friend Scott Redler.
The franchise was named in honor of Bill and Randy’s father, Freddy Simon, a World War II veteran and Purple Heart recipient.
The founders sought to create a dining experience reminiscent of the late 1940s and early 1950s, focusing on quality, genuine hospitality, cleanliness, and timeless traditions.
The first Freddy’s location opened its doors in Wichita, and the response from the community was overwhelmingly positive.
This led to the opening of the first franchise location in 2004. Since then, Freddy’s has grown rapidly, expanding to over 500 locations across 36 states, including international expansions into Canada.

Initial Investment
How much does it cost to start a Freddy’s franchise? It costs on average between $786,000 – $2,754,000 to start a Freddy’s franchised restaurant.
This includes costs for construction, equipment, inventory, and initial operating expenses. The exact amount depends on various factors, including the type of restaurant you choose, the location, and whether the franchisee chooses to lease or purchase the property. Freddy’s offers 3 types of franchises:
| Type of Expenditure | In-Line (No Drive-thru) | End Cap (With Drive-thru) | Standalone (With Drive-thru) |
|---|---|---|---|
| License Fee | $35,000 | $35,000 | $35,000 |
| Training Costs and Expenses | $10,000 – $40,000 | $20,000 – $60,000 | $20,000 – $60,000 |
| Construction and Leasehold Improvements | $270,000 – $500,000 | $750,000 – $1,600,000 | $950,000 – $1,800,000 |
| Real Property Rent (1 month) | $5,667 – $12,500 | $5,667 – $15,750 | $5,667 – $15,750 |
| Security Deposit | $5,667 – $12,500 | $5,667 – $15,750 | $5,667 – $15,750 |
| Technology & Ordering Systems | $30,102 – $58,665 | $53,764 – $99,066 | $53,764 – $99,066 |
| Equipment, Furniture, Fixtures and Décor | $375,000 – $400,000 | $350,000 – $500,000 | $350,000 – $500,000 |
| Signage and Lighting | $12,000 – $30,000 | $15,000 – $60,000 | $25,000 – $115,000 |
| Miscellaneous Opening Costs | $8,000 – $15,000 | $8,000 – $15,000 | $8,000 – $15,000 |
| Opening Inventory and Supplies | $10,000 – $25,000 | $10,000 – $25,000 | $10,000 – $25,000 |
| Insurance | $2,000 – $5,000 | $2,000 – $7,000 | $2,000 – $8,000 |
| Grand Opening Advertising | $2,500 – $5,000 | $2,500 – $5,000 | $2,500 – $5,000 |
| Additional Funds – 3 Months | $20,000 – $60,000 | $20,000 – $60,000 | $20,000 – $60,000 |
| Total Estimated Initial Investment | $785,936 – $1,198,665 | $1,277,598 – $2,497,566 | $1,487,598 – $2,753,566 |
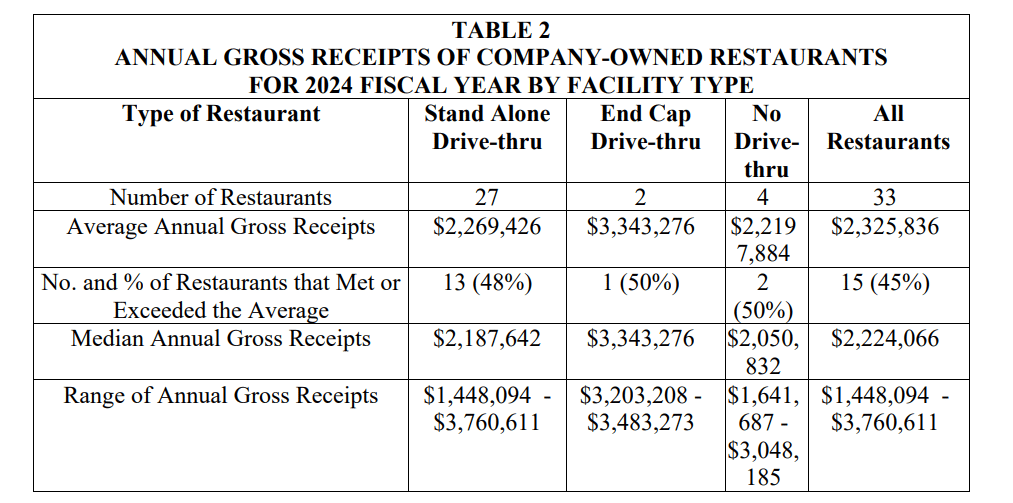
Average Revenue (AUV)
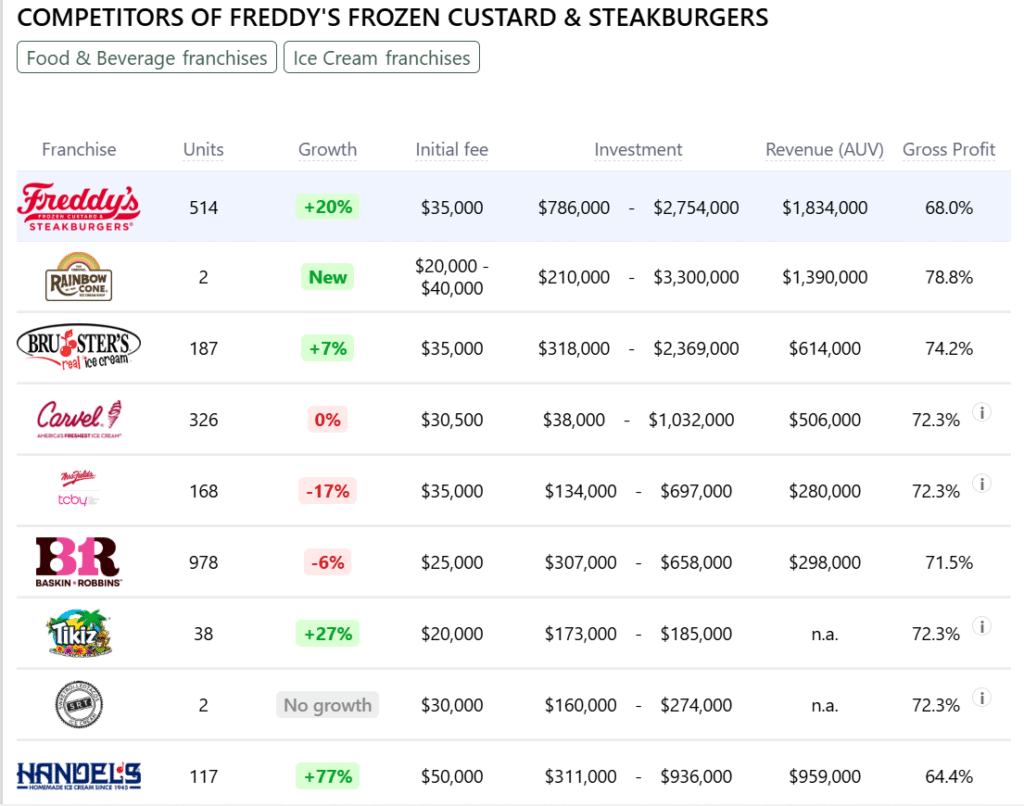
How much revenue can you make with a Freddy’s franchise? A Freddy’s franchised restaurant makes on average $1,834,000 in revenue (AUV) per year.
Here is the extract from the Franchise Disclosure Document:
This compares to $515,000 yearly revenue for similar ice cream franchises. Below are a few Freddy’s competitors as a comparison:
Download the Franchise Disclosure Document
Frequently Asked Questions
How many Freddy’s locations are there?
As of the latest data, Freddy’s Frozen Custard & Steakburgers operates 550 locations across the United States. 514 of these locations are franchise-owned, reflecting the brand’s strong franchise development model.
Freddy’s also has a smaller number of company-owned locations, though exact figures on this are less publicly available. In addition to its current locations, Freddy’s has more than 130 new locations in development, further expanding its footprint across 36 states.
What is the total investment required to open a Freddy’s franchise?
The total investment required to open a Freddy’s franchise ranges from $786,000 to $2,754,000.
What are the ongoing fees for a Freddy’s franchise?
For a Freddy’s Frozen Custard & Steakburgers franchise, the ongoing fees include a royalty fee of 4.5% of gross sales. Additionally, franchisees are required to pay a marketing fee of 0.375% of gross sales. These fees contribute to the support and resources provided by the franchisor, as well as national advertising campaigns aimed at promoting the brand and driving traffic to franchise locations.
What are the financial requirements to become a Freddy’s franchisee?
To become a Freddy’s Frozen Custard & Steakburgers franchisee, the financial requirements include a minimum net worth of $850,000 and liquid capital of at least $250,000. These financial thresholds ensure that prospective franchisees have the resources to cover initial investments, operating costs, and unforeseen expenses during the startup phase.
How much can a Freddy’s franchise owner expect to earn?
The average gross sales for a Freddy’s franchise are approximately $1.83 million per location. Assuming a 15% operating profit margin, $1.83 million yearly revenue can result in $275,000 EBITDA annually.
Who owns Freddy’s?
Freddy’s Frozen Custard & Steakburgers is owned by Thompson Street Capital Partners, a private equity firm based in St. Louis. In 2021, Thompson Street acquired Freddy’s from its co-founders and previous investors to further expand the brand. The acquisition has allowed Freddy’s to continue its rapid growth across the United States while maintaining its commitment to quality and customer service.
Disclaimer
Disclaimer: This content has been made for informational and educational purposes only. We do not make any representation or warranties with respect to the accuracy, applicability, fitness, or completeness of the information presented in the article. You should not construe any such information or other material as legal, tax, investment, financial, or other professional advice. Nothing contained in this article constitutes a solicitation, recommendation, endorsement, advertisement, or offer to buy or sell any franchises, securities, or other financial instruments in this or in any other jurisdiction in which such solicitation or offer would be unlawful under the franchise and/or securities laws of such jurisdiction.
All content in this article is information of a general nature and does not address the detailed circumstances of any particular individual or entity. Nothing in the article constitutes professional and/or financial and/or legal advice, nor does any information in the article constitute a comprehensive or complete statement of the matters discussed or the law relating thereto. You alone assume the sole responsibility of evaluating the merits and risks associated with the use of any information or other content in this article before making any decisions based on such information or other content.