
How to Build a Cohort Model in Excel [+ Free Template]

Customer retention is by definition the pattern by which certain customers, after converting a first time, come back to perform certain actions in the future. Therefore, a cohort model is a very powerful component of any Excel financial model to forecast things like churn and customer engagement.
These actions can be conversions, but not necessarily: sign-ups, logins, add-to-cart, etc.
We typically use cohort analyses to assess marketing campaigns’ effectiveness. This is also something we used in all our financial model templates to model customer retention.
We’ve also included below a link to our free cohort model template so you can follow along. Let’s dive in!
What is a cohort analysis?
A cohort is a group of users who share common characteristics over a certain period of time. Cohort analysis is the study of the common characteristics of these users.
In marketing, we use it to analyse the engagement of customers (or users) over time. Because customers are onboarded at different points in time, they didn’t necessarily have the same onboarding, or customer experience overall.
As such, some cohorts may be more engaged than others over time: this is where comparing different cohorts is really useful.
You might implement email marketing, or discount codes on following purchases for instance. These are two examples of marketing levers that may improve customer engagement (or retention).
By looking at the cohorts’ retention over time (whether they buy more, or visit your website more often for instance), you can form conclusions on whether your marketing actions were helpful or not.
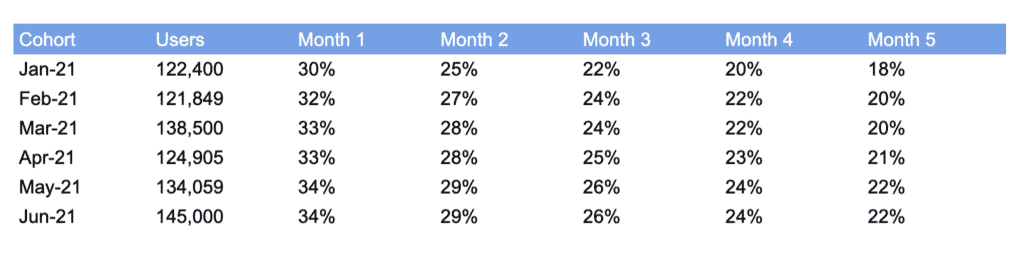
In the example below, we can see that overall customer retention improved over time. Let’s assume that we are looking at a mobile app product, and the table below depicts the number of Monthly Active Users (MAUs) over time.
When looking at the number of MAUs by month 5 after onboarding, there is clearly an improvement: 22% of users who onboarded in June 2021 were still active (MAUs) 5 months later vs. 18% for January 2021.
Excel cohort model: why do we use it in finance?
A cohort model is often used in Excel financial modelling when projecting a business’ financials: we use it to project churn and customer engagement (e.g. repeat purchases).
Let’s use 2 examples to make it clearer below: a mobile app (churn) and a ecommerce business (customer engagement).
Excel cohort model for churn
It is quite common for mobile app business to suffer from significant churn, especially very early on. As explained in our article here, 73% of mobile app users churn after 90 days in average..!
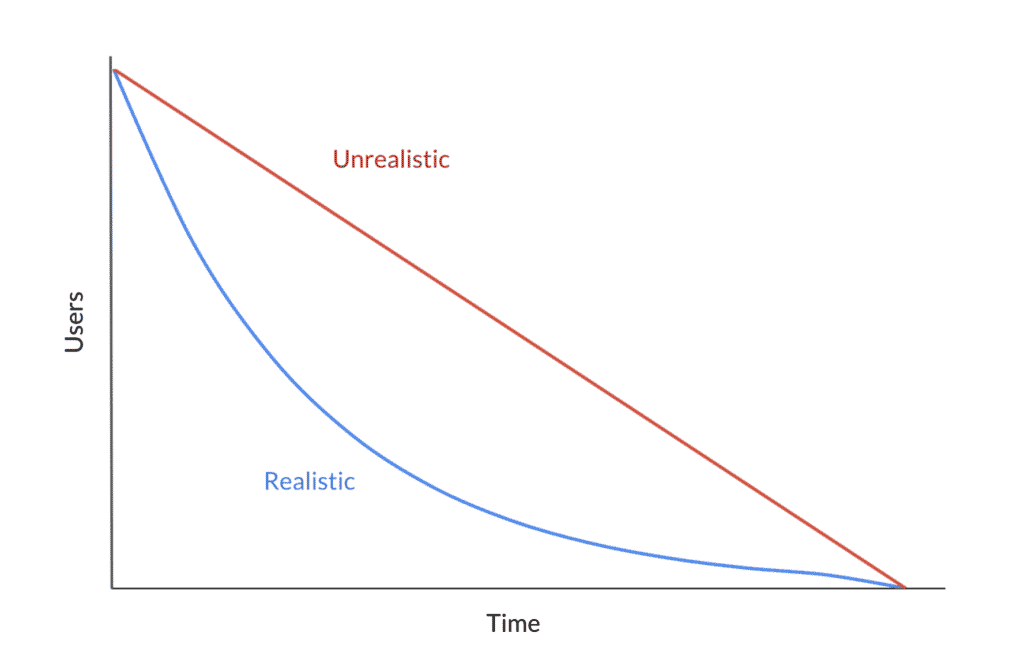
Cohort analysis is important here because churn is not straight over time but decreases instead over time (as can be seen in our example below).
Excel cohort model for customer engagement
Whenever we need to project engagement, we must use cohort analysis. Engagement can take forms: whether a customer returns to your website, makes a purchases, interacts with a specific tool, etc.
Ecommerce is a great example here. Customers who bought once might buy multiple times over their lifetime. This is really important for 2 reasons:
- Repeat customers typically spend more (higher AOV) and have higher conversion rates
- Repeat customers tend to come more organically vs. new customers. In other words, their cost of acquisition (CAC) is lower: you are not spending anything in customer acquisition cost (e.g. paid ads) for their future purchases
See our article here on the most important ecommerce metrics.
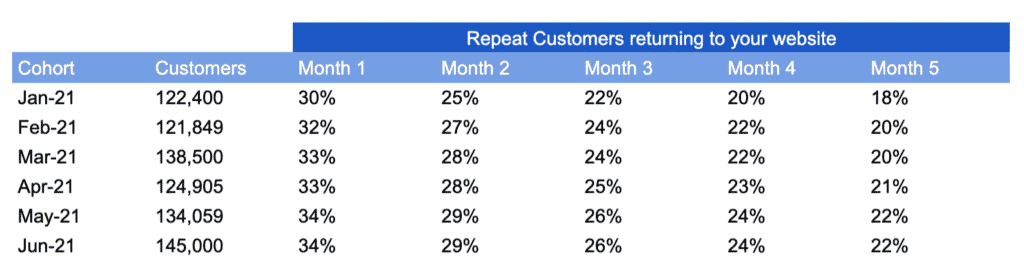
To project repeat customers, and for instance their purchases, we use a cohort analysis too. First, we need to project the number of customers who return to your website over time. Likely, you will suffer some churn from this group over time (they will come back, but less and less over time).
Using the very same numbers as for our example earlier, we can now forecast repeat customers for an ecommerce business:
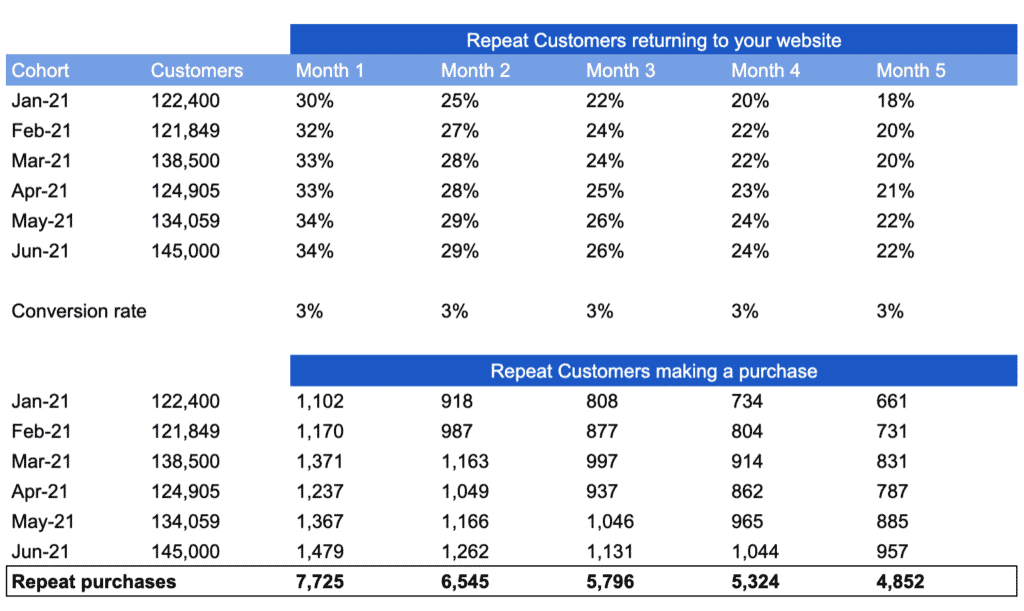
Now, assuming repeat customers have a 3% conversion rate, we can estimate future purchases from future customers over time:
How to build a cohort model in Excel
Let’s use the ecommerce example to calculate the number of purchases you expect to generate from repeat customers. That way, we will forecast repeat purchases over a period of 24 months thanks to a Excel cohort model.
Download our free template here to follow along.
Let’s use a few assumptions first:
- 20% of customers are repeat customers. This means that 20% only of your customers will make at least 2 purchases over their lifetime
- Purchase frequency is 3 purchases per year: repeat customers will buy at a rate of 3 purchases a year
- Churn will be 20% per annum: repeat customers will churn over time at a rate of 20% p.a.
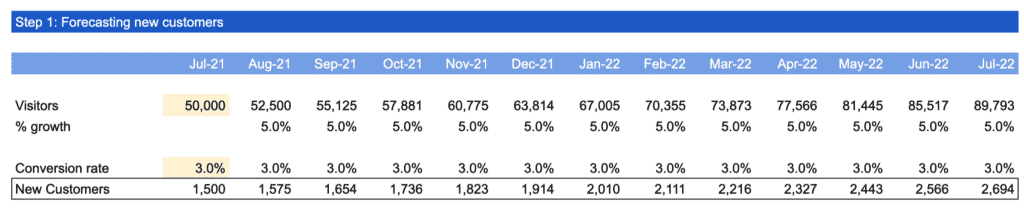
Step 1: Forecast new customers
Let’s assume you had 50,000 visitors in the past month, and you estimate visitors to grow at 5% per month. Let’s assume visitors convert at a 2% conversion rate.
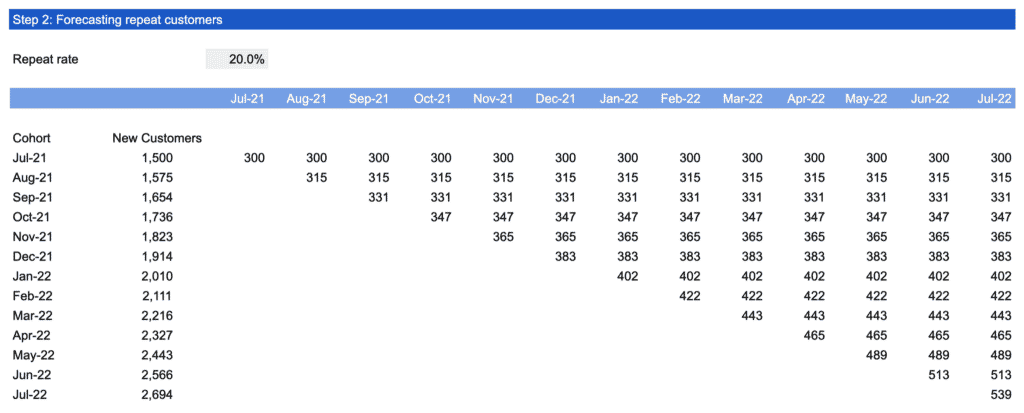
Step 2: Forecast repeat customers
Let’s apply our 20% repeat rate to estimate repeat customers over time.
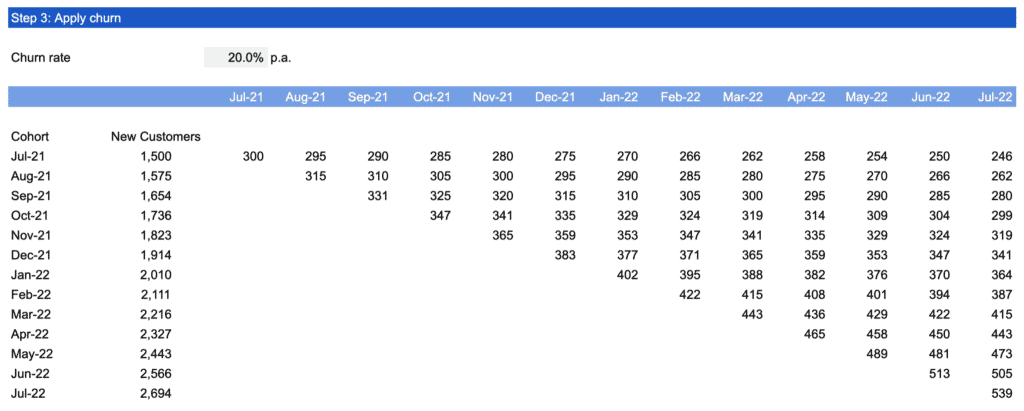
Step 3: Apply churn
As we say earlier, repeat customer will churn over time at a rate of 20% p.a.
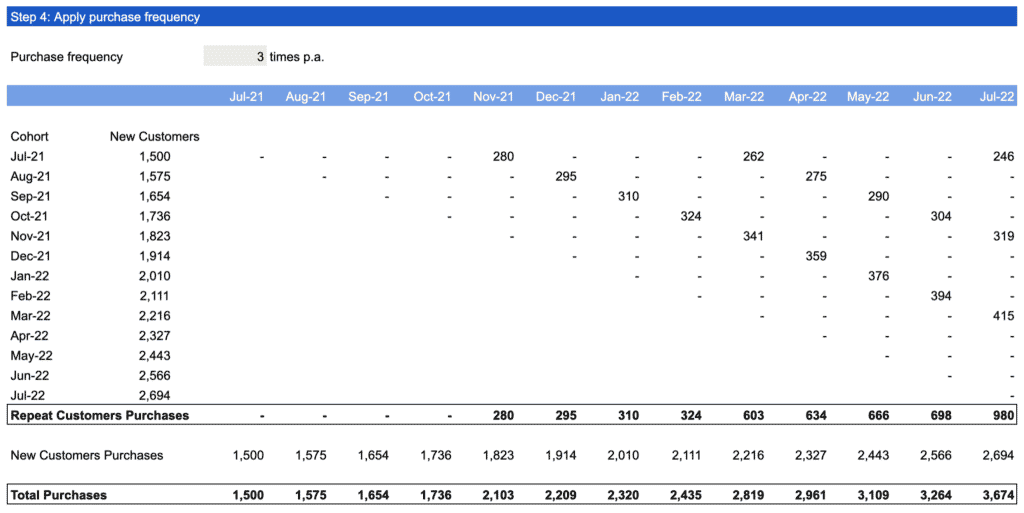
Step 4: Apply purchase frequency
Repeat customers might not buy every month. Instead, we said earlier they will buy at a rate of 3 times per year (i.e. every 4 months).
By applying purchase frequency, we now obtain the number of purchases from repeat customers. Adding repeat purchases to new purchases, we estimated the number of purchases you expect to generate from your customers over time.
Expert-built financial model templates for tech startups
 5-year pro forma financial model
 20+ charts and business valuation
 Free support