
How to Estimate TAM, SAM And SOM for your Startup?

When one needs to assess the size of the market for a product or a startup, we often refer to Total Addressable Market (TAM), Serviceable Available Market (SAM) and Serviceable Obtainable Market (SOM).
While these terms may be confusing at first, they refer to different notions of market sizing.
In this article we’ll go through what are TAM, SAM and SOM, and how you can use them to assess the market value for your startup. Let’s dive in!
What is TAM, SAM and SOM?
Before we jump into what are the different definitions for these 3 terms, it’s important to note that they all refer to a different market definition for a business, a startup or a product.
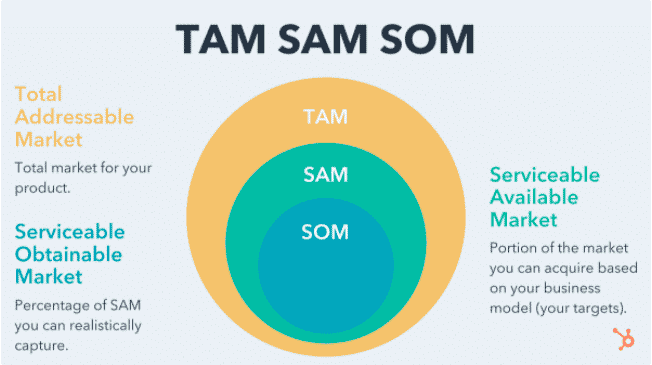
Total Addressable Market (TAM)
TAM = total market size for your product
TAM is the largest market and the most broad definition of a market for a product or a business.
Let’s use 2 examples of different business models to understand what it means:
| Restaurant | B2B marketplace | |
|---|---|---|
| Description | London-based casual Italian food restaurant | UK-based residential care supplies B2B marketplace |
| TAM | Worldwide restaurant industry | Worldwide healthcare supplies industry |
Serviceable Addressable Market (SAM)
SAM = total market size you can serve
Although TAM is defined as the total market size for your product (the global market value for the industry you are competing in for example), SAM refers to the part of the market you can actually serve.
Indeed, while your business is competing, say, in the global pharmaceutical industry, you can’t realistically sell any pharmaceutical product to all customers worldwide.
Factors that restrict your reach usually are:
- Geographical reach: you likely do not have a global reach, even if your business is digital
- Specialization : you may not offer all the products available in the industry
- Production / financial capacity: even if everyone wanted to buy from you, you would not have the capacity to produce and sell to everyone
Using our 2 examples, it is fair to say that your business is not able to service their respective TAM. In that case, SAM would be:
| Restaurant | B2B marketplace | |
|---|---|---|
| Description | London-based casual Italian food restaurant | UK-based residential care supplies B2B marketplace |
| TAM | Worldwide restaurant industry | Worldwide healthcare supplies industry |
| Factors restricting reach | Specialization: casual restaurant vs. fast food, fine dining, etc. Geography: London | Specialization: residential care supplies Geography: B2B healthcare supplies |
| SAM | London casual Italian food restaurant market | UK B2B healthcare care supplies industry |
Expert-built financial model templates for tech startups
 5-year pro forma financial model
 20+ charts and business valuation
 Free support
Serviceable Obtainable Market (SOM)
SAM = total market size you can realistically reach
We have established what is your SAM, yet it is realistically not the market you could actually capture.
Think about it, there are likely other competitors offering product alternatives. Even if you would be in a monopoly, it is very possible you could not capture 100% of the market for other factors (think about customer preferences).
For instance, it is not because you are the only Italian food restaurant in town that everyone will buy Italian food from you (some might not like your restaurant and choose to buy their own supplies online).
Therefore, SOM for the 2 businesses we looked at earlier could be:
| Restaurant | B2B marketplace | |
|---|---|---|
| Description | London-based casual Italian food restaurant | UK-based residential care supplies B2B marketplace |
| TAM | Worldwide restaurant industry | Worldwide healthcare supplies industry |
| Factors restricting reach | Specialization: casual restaurant vs. fast food, fine dining, etc. Geography: London | Specialization: B2B healthcare supplies Geography: UK |
| SAM | London casual Italian food restaurant market | UK B2B healthcare care supplies industry |
| Factors restricting reach | Geography: London zone 1/2 | Specialization: B2B residential care healthcare supplies |
| SOM | Downtown London (zone 1/2) casual Italian food restaurant market | UK B2B residential care supplies industry |
So what exactly is the difference between SAM and SOM?
While TAM is relatively straightforward, you may be confused by the difference between SAM and SOM. The difference between these 2 market definitions can be summed up below:
While you only sell products and services to customers in your Serviceable Obtainable Market (SOM), individuals (or businesses) in your Serviceable Addressable Market (SAM) aren’t buyers of your products.
Again, using the 2 examples earlier:
- A downtown (zone 1/2) Italian London restaurant isn’t competing with an Italian restaurant in zone 3/4. Even if people travel to go to restaurants, they are mostly local customers, and one customer in zone 1/2 will rarely go to a zone 3/4 and vice versa
- A UK B2B residential care supplies marketplace sells to business customers in the residential healthcare industry, and not to any business customer in the healthcare industry

How to calculate TAM, SAM and SOM?
Market sizing always lies in assumptions, data and calculations. TAM, SAM and SOM are no different. In order to form the most accurate estimation of your SOM for your startup, 2 methods are commonly used.
1. Top-down approach
This is the most common approach simply because it is the easiest to calculate yet is more inaccurate. In short, we estimate SOM by starting from TAM, and going down to SAM and SOM using public sources data and your own assumptions.
Using our B2B marketplace example, let’s assume we know from public sources the worldwide healthcare supplies market is estimated at ~$80 bn (that’s our TAM).
Looking at SAM, we estimate from these public sources and GDP figures the UK B2B healthcare supplies to be 8% of the global market, our SAM therefore is ~$7 bn.
Now, from our research we know UK Residential care spend as a percentage of total UK healthcare spend is 30%, therefore we estimate SOM to be ~$2 bn.
| Market | Description | UK-based residential care supplies B2B marketplace |
|---|---|---|
| TAM | Worldwide healthcare supplies market | $80 billion |
| SAM | UK B2B healthcare supplies market | $7 billion |
| SOM | UK residential care supplies market | $2 billion |
As you would notice, our SOM is highly dependent on our assumptions and the lack of verified sources. Investors would typically ask for sources (articles, research reports, etc.) to back up your numbers.
Expert-built financial model templates for tech startups
5-year pro forma financial model
20+ charts and business valuation
Free support
2. Bottom-up approach
This is the most accurate approach when estimating SOM. As such, to the extent possible and the availability of information, you should opt for a bottom-up SOM estimation for your market sizing, especially if you are launching a product, a startup and/or fundraising.
Using a bottom-up approach, we start from your one average customer (or product) and calculate SOM by extrapolating. SOM is, as we explained above, the most important market you should care about. Using bottom-up, we do not need to calculate SAM nor TAM as they do not matter as we (and investors) only care about the Serviceable Obtainable Market.
Using our B2B marketplace example, let’s assume we know the following:
- There are 10,000 residential care homes in the UK
- Each care home spend in average $250k per year in healthcare supplies
An estimation of SOM could therefore be $2.5bn (which is more or less in line with our top-down approach calculation above).
Note: Another common way to estimate SOM for established businesses simply is to take revenues and sum up all your competitors revenues (if information is available of course). It is fairly useful for niche markets where competitors aren’t many.
Why is it important when forecasting your revenues?
Every startup building financial projections should spend time assessing their SOM in order to build realistic revenue projections. As explained earlier, unfortunately you will not be able to service your TAM, SAM or even SOM (even in a monopoly).
That’s why we need to apply a realistic market share percentage you expect to acquire over time. This percentage will be applied to your SOM. This will give you a good estimate of your expected revenues.
As explained in our article on why should have a solid financial model, the more your financial projections are backed up with verified assumptions and sources, the more credible they will be and the fairer deal you will get from investors.
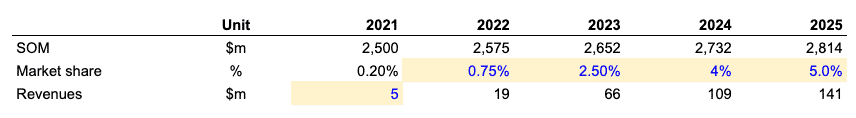
Using our B2B marketplace example again, let’s forecast our expected revenues using our bottom-up approach:
- SOM is $2.5bn and is expected to grow at 3% CAGR over 2021 – 2025
- Our startup was founded 3 years ago and revenues are $5m today
- We estimate to capture 5% of the total market by 2025
For high-level revenues projections, using such approach alone is fine.
Yet in order to build a solid financial model for your startup fundraising, assessing SOM to forecast revenues should ideally be used in conjunction with a more detailed, per-customer approach as explained in our article here.
Think about it, let’s assume you built your financial model without looking at SOM and expect to generate $500m revenues by 2025.
This represents ~20% of the total market whilst you only have 0.20% today. Does this 100x market share increase really make sense?
Looking at both SOM and a bottom-up, per-customer approach when assessing your revenues will both give you maximum credibility to investors and make sure you are setting realistic targets.
Expert-built financial model templates for tech startups
5-year pro forma financial model
20+ charts and business valuation
Free support