How To Use The Cash Burn Analysis Dashboard: Tutorial

Most entrepreneurs ask us the same question: how much should I raise? That’s why we included in our financial model templates a simple yet powerful tool for you to know exactly how much you should raise: the cash burn analysis dashboard.
As explained in our article here, raising more is not necessarily better. Instead, the amount you should raise must cover your expected cash burn (expenses minus revenues) over a given period (the “runway“).
In this article we explain you, step-by-step, how you should use this tool. Meet investors with confidence and know exactly how much you should raise for your fundraising.
Step 1. Build your financial projections
As explained above and in our article here, the amount you should raise must cover your expected cash burn over a given period: your runway.
Therefore, before using the dashboard tool, you need to build financial projections for your business. If you are using our templates, refer to our tutorials here. No need to be a finance wizard. Simply download one of our templates and enter your assumptions thanks to our step-by-step tutorials or our onboarding videos.
Remember: your financial forecasts need to be realistic. Indeed, the amount you need to raise depends on your cash burn, which itself depends on your financial projections. As such, if your financial forecasts are too optimistic, the amount you need to raise will very likely be wrong.
Whether you are overestimating your revenues or underestimating expenses, if your startup revenue projections miss the mark you will likely encounter challenges down the road. Read our article on how to build realistic revenue projections for your startup for more information.
Build rock-solid financial projections that get you funded
Step 2. Select your runway
When using the cash burn analysis tool, the first thing we need to do is to select your runway. The runway is the number of months you want your fundraising round to last. Most rounds usually last 12-18 months, sometimes 24 months.
By choosing a runway, the model will automatically calculate 2 things:
- Gross Cash Burn: the total amount of expenses you incur over the runway period
- Net Cash Burn: the total amount of expenses you incur, minus the revenues you expect to generate over the runway period
What is really important for us here is Net Cash Burn. Why? It is the actual amount of cash you are short of, and which we need to raise as part of this round.
Let’s use an example. Let’s assume you have built your projections and you are looking at 2 different runway periods: 12 and 18 months. You obtain the following 2 tables:
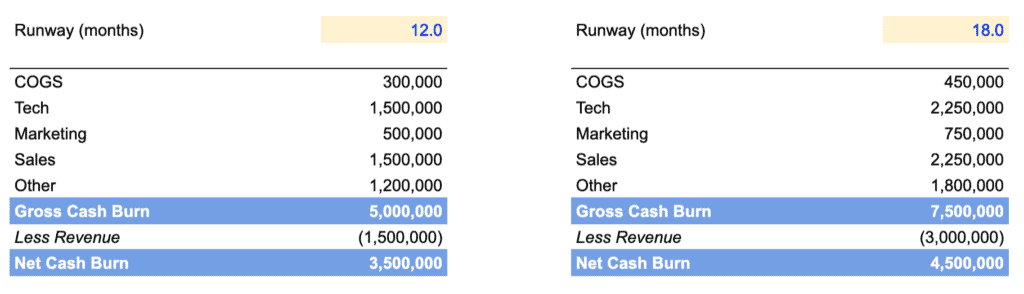
The model tells us that from today:
- Over the next 12 months: you will spend $5 million, net of $1.5 million revenues. So a Net Cash Burn of $3.5 million
- Over the next 18 months: you will spend $7.5 million, net of $3 million revenues. So a Net Cash Burn of $4.5 million
Of course, as a startup, the higher the runway, the better. Ideally, you should set a long runway. The problem is that you might not able to raise as much.
That’s why the model is quite helpful. If, for instance, you want to raise $4.5 million (to last 18 months) but investors only want to give you $3.5 million, you know what it means in terms of runway for you. In other words, you know how long you will last, and when you will need to raise again.
Step 3. Set the fundraising round
We said earlier your fundraising round is your Net Cash Burn. In our example above, assuming a 18 months runway, Net Cash Burn is $4.5 million.
Note: do not confuse “Net Cash Burn” with “Burn Rate”. The burn rate is your monthly cash burn. We call it burn rate as it gives an idea of how long (how many months) your startup can last with the current cash you have in the bank today.
Still, we should include a buffer, in case things do go as planned. Indeed, your projections might be realistic, there is always a margin of error. As such, include a 25-50% buffer on top of Net Cash Burn. Logically, the more conservative are your projections, the less buffer you should include.
In our example, Net Cash Burn is 4.5 million. Assuming a 25% buffer, our fundraising should be approximately $6 million.
Fundraising Round = Net Cash Burn + Buffer
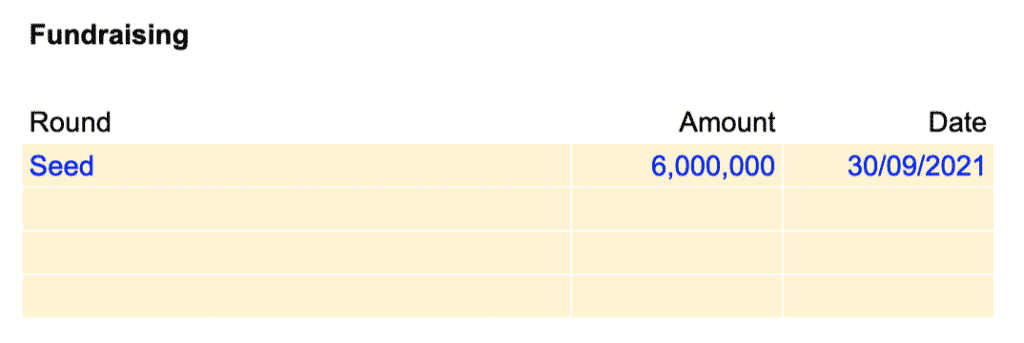
In order to enter the $6 million in our financial model template, refer to the Settings sheet, under “Fundraising” as shown below. To do so, you will need to enter 3 things:
- Name of your fundraising round: “Seed” here
- Amount: $ 6 million
- Date: here you expect to raise in September 2021. This is the date when you will actually receive the cash in your bank account.
Note: raising equity can easily take weeks, if not months as explained in our article here (unlike debt). As such, we are in September 2021 and you start to meet investors next month, do not set as a date September 2021 but November or December 2021 instead.
Step 4. Analyse your runway
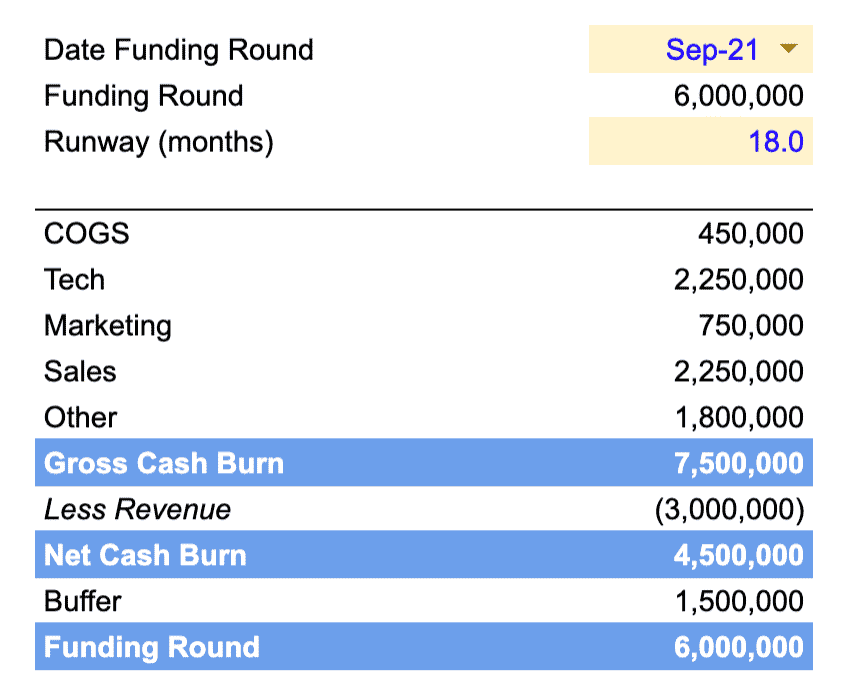
When using the cash burn analysis tool, the last thing we need to do is to select the date of the fundraising you want to analyse. Here, we need to select 30/09/2021 (or Sep-21) in the drop-down list: the $6 million we have just set earlier.
The analysis of your runway, thanks to the cash burn analysis tool, allows us to answer 2 key questions from investors:
- How much should you raise?
- Where will you spend your money?
How much should you raise?
As we say earlier, the model allows us to assess accurately what is the optimal amount of capital you should raise. This amount is a function of 2 things we have set together: your expected runway, and your financial projections.
In our example above, we are raising $ 6 million as we need $ 4.5 million to last the next 18 months based on our financial forecasts.
Where will you spend your money?
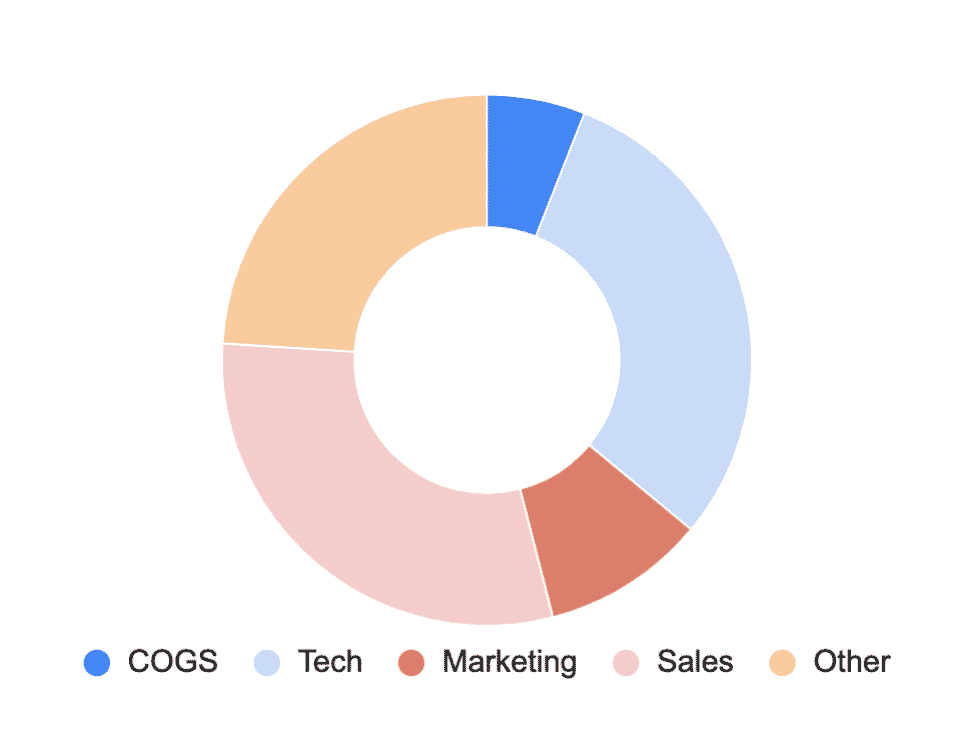
The model calculates automatically the buffer ($1.5 million) as well as the breakdown of the different expenses categories where you will spend your money during the runway (here the next 18 months).
The cash burn analysis dashboard also automatically creates a very important chart: where you will spend your money. If you are fundraising from investors, you should include such chart in your pitch deck for instance.
Get help
That’s it! We have been through all the different steps you need to follow to use the cash burn dashboard. You are now able to answer 2 key questions from investors: how much you should raise, and where you will spend your money.
Remember: the cash burn dashboard is included in all our templates. If you haven’t yet downloaded your template, you can do so below: