
Jamba Franchise FDD, Profits & Costs (2025)
Jamba Juice, an iconic brand in the smoothie industry, was founded in 1990 in San Luis Obispo, California. Initially known as a small juice shop, the company has since expanded to become a leader in offering freshly blended fruit and vegetable smoothies, juices, and bowls.
The headquarters of Jamba Juice is located in Frisco, Texas. The company began franchising in 1993 and has grown significantly over the years across various states and countries.
Jamba differentiates itself in the market with a focus on health and convenience, offering high-quality, flavorful blends made with real ingredients, such as whole fruits and vegetables, without artificial flavors or preservatives.
The franchise prides itself on its commitment to making eating better both easy and delicious. Their menu is designed to provide quick, healthy options that cater to busy lifestyles.

Initial Investment
How much does it cost to start a Jamba franchise? It costs on average between $243,000 – $1,133,000 to start a Jamba franchised restaurant.
This includes costs for construction, equipment, inventory, and initial operating expenses. The exact amount depends on various factors, including the type of restaurant you choose, the location, and whether the franchisee chooses to lease or purchase the property. Jamba offers 4 types of franchises:
| Store Type | Initial Investment Range |
|---|---|
| Traditional Store (No Drive-Thru) | $468,650 to $806,250 |
| Traditional Store (With Drive-Thru) | $505,000 to $928,800 |
| Non-Traditional Store | $243,425 to $746,850 |
| Co-Branded Auntie Anne’s Store | $460,375 to $1,133,000 |
We are summarizing below the main costs associated with opening a Jamba Traditional Store (With Drive-Thru). For more information on costs required to start a Jamba franchise, refer to the Franchise Disclosure Document (Item 7).
| Type of Expenditure | Amount |
|---|---|
| Initial Franchise Fee | $35,500 |
| Construction and Build Out Costs | $200,000 – $390,400 |
| Permitting | $1,800 – $21,000 |
| Equipment Package | $146,300 – $180,250 |
| Millwork | $9,000 – $20,500 |
| Furniture | $400 – $6,050 |
| Menu Board, Graphics, and Interior Signage | $2,100 – $10,300 |
| Exterior Signage | $25,500 – $62,100 |
| Computer System | $13,400 – $31,300 |
| Smallwares | $4,000 – $5,500 |
| TV/Music | $0 – $4,000 |
| Architect/Engineer | $13,900 – $27,000 |
| Rent | $4,000 – $10,000 |
| Grand Opening Marketing | $10,000 |
| Legal and Accounting Fees | $5,000 – $10,000 |
| Insurance | $1,500 – $8,100 |
| Misc. Opening Costs/Office Supplies | $9,000 – $14,000 |
| Security Deposits | $0 – $15,000 |
| Management Training Program Fee | $0 – $3,000 |
| Travel and Living Expenses during Training | $3,600 – $5,700 |
| On-Site Training Fee | $0 – $6,100 |
| Opening Inventory | $5,000 – $10,000 |
| Additional Funds – 3 Months | $15,000 – $43,000 |
| Total Initial Investment | $505,000 – $928,800 |
Average Revenue (AUV)
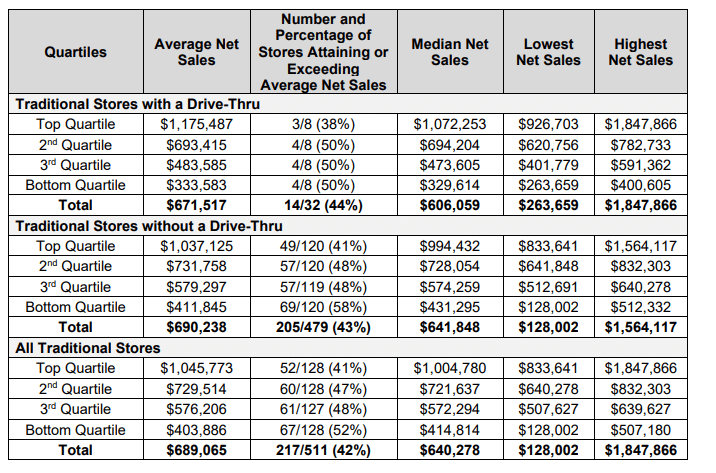
How much revenue can you make with a Jamba franchise? A Jamba franchised restaurant makes on average $640,000 in revenue (AUV) per year.
Here is the extract from the Franchise Disclosure Document:
Jamba Franchise Disclosure Document
Frequently Asked Questions
How many Jamba locations are there?
As of the latest data, Jamba operates a total of 726 franchised locations and 1 company-owned stores. Over the years, Jamba has transitioned to a primarily franchise-driven model, significantly reducing the number of company-owned outlets.
This shift allows franchisees to play a larger role in the brand’s expansion across various markets, while the company focuses on supporting franchisees with branding, marketing, and operational strategies.
What is the total investment required to open a Jamba franchise?
The total investment required to open a Jamba franchise ranges from $243,000 to $1,133,000.
What are the ongoing fees for a Jamba franchise?
Jamba franchisees are required to pay a 6% royalty fee on gross sales. Additionally, there is a 4% advertising and marketing fee based on gross sales, which covers contributions to both national and local marketing efforts.
Who owns Jamba?
Jamba is owned by Focus Brands, an Atlanta-based company that also owns several other well-known franchise brands, including Cinnabon, Auntie Anne’s, and Moe’s Southwest Grill. Focus Brands acquired Jamba in 2018.
Disclaimer
Disclaimer: This content has been made for informational and educational purposes only. SharpSheets is an independent educational resource and is not affiliated with, endorsed by, or representing any franchisor mentioned on this website. Where noted, figures are taken from the franchisor’s Franchise Disclosure Document (FDD). In some cases, we may provide independent calculations or estimates based on publicly available information. We do not make any representation or warranties with respect to the accuracy, applicability, fitness, or completeness of the information presented in the article. You should not construe any such information or other material as legal, tax, investment, financial, or other professional advice. Nothing contained in this article constitutes a solicitation, recommendation, endorsement, advertisement, or offer to buy or sell any franchises, securities, or other financial instruments in this or in any other jurisdiction in which such solicitation or offer would be unlawful under the franchise and/or securities laws of such jurisdiction.
All content in this article is information of a general nature and does not address the detailed circumstances of any particular individual or entity. Nothing in the article constitutes professional and/or financial and/or legal advice, nor does any information in the article constitute a comprehensive or complete statement of the matters discussed or the law relating thereto. You alone assume the sole responsibility of evaluating the merits and risks associated with the use of any information or other content in this article before making any decisions based on such information or other content.


