
Jason’s Deli Franchise FDD, Profits & Costs (2025)
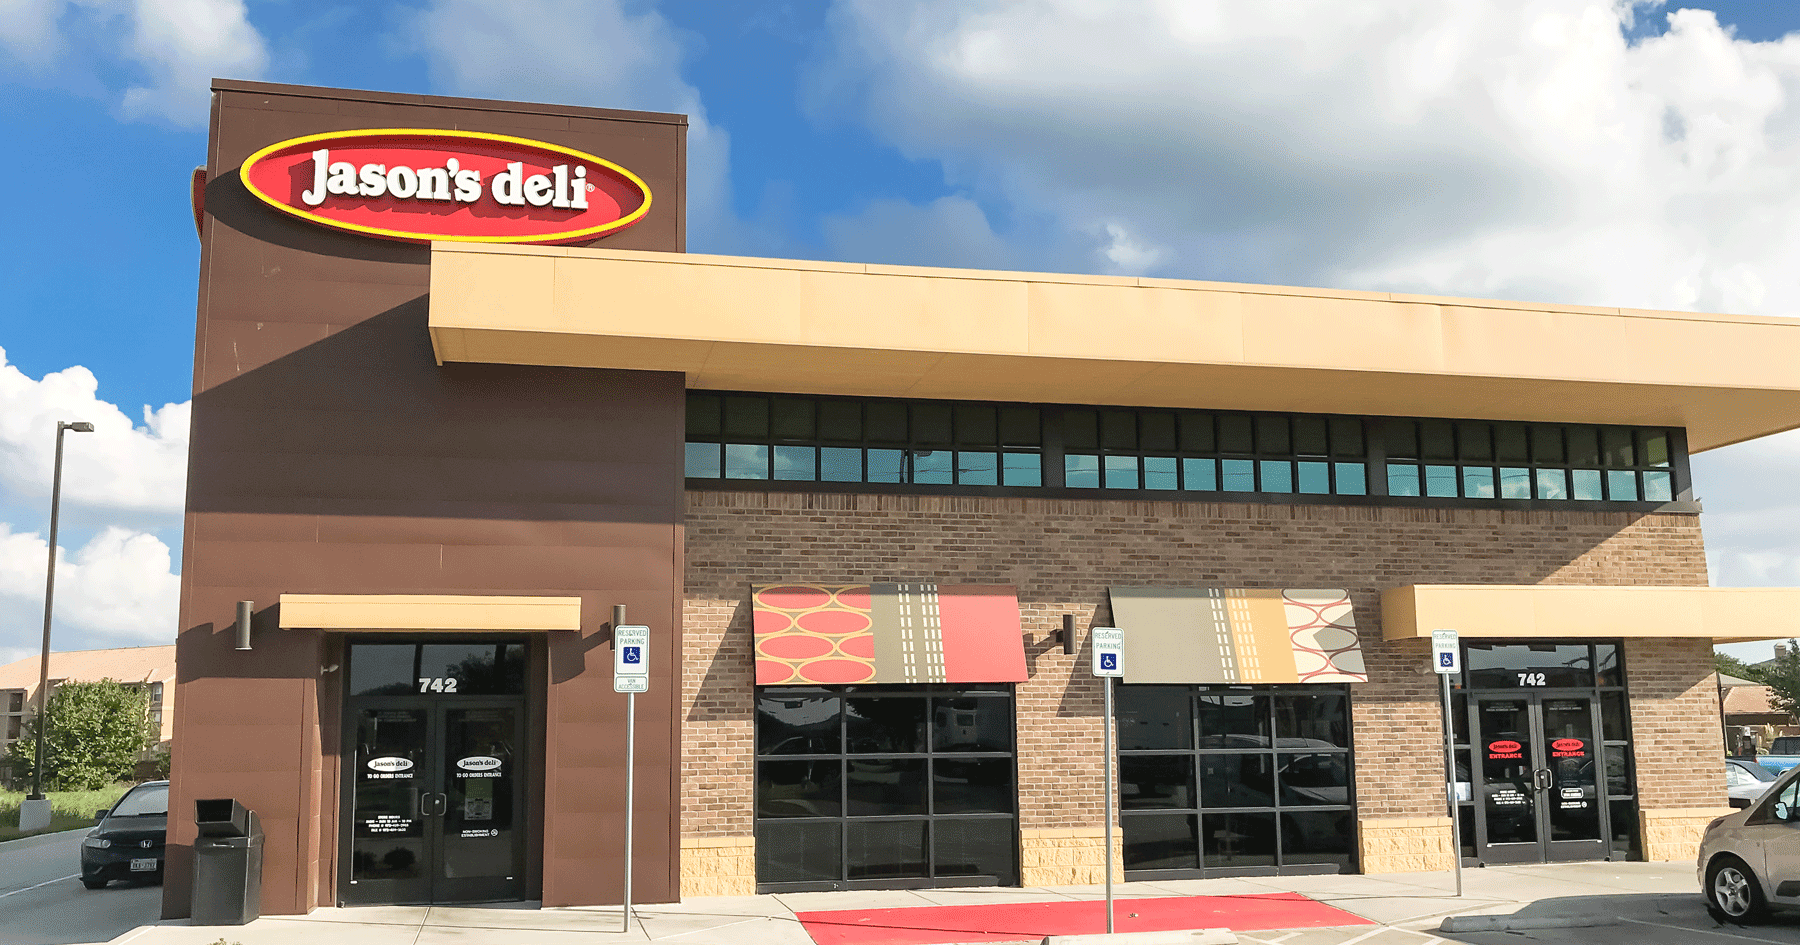
Jason’s Deli is a renowned franchise in the fast-casual restaurant sector, known for its commitment to healthy food options and a diverse menu that caters to various dietary preferences.
Founded in 1976 by Joe Tortorice Jr. and his partners, the chain has its roots in Beaumont, Texas, where it began as a small deli but quickly grew in popularity. Today, Jason’s Deli has its headquarters in Beaumont, Texas.
The franchise distinguishes itself by its dedication to quality and health-conscious food. It was one of the first restaurant groups to eliminate artificial trans fats, MSG, high-fructose corn syrup, dyes, and artificial colors from its offerings.
Jason’s Deli offers a wide range of menu items including sandwiches, salads, pastas, and baked potatoes, along with specialized menus catering to vegetarian and gluten-sensitive customers.

Initial Investment
How much does it cost to start a Jason’s Deli franchise? It costs on average between $1,720,000 – $2,529,000 to start a Jason’s Deli franchised restaurant.
This includes costs for construction, equipment, inventory, and initial operating expenses. The exact amount depends on various factors, including the type of restaurant you choose, the location, and whether the franchisee chooses to lease or purchase the property.
| Type of Expenditure | Amount |
|---|---|
| Initial Franchise Fee | $35,000 |
| Development Fee | $17,500 per additional deli, total $35,000 |
| Travel and living expenses while training | $18,000 |
| Build out or remodeling of 4,500-5,000 sq. ft. premises | $950,000 to $1,600,000 |
| Equipment: | |
| *Fabricated and Buyout Equipment | $460,000 |
| *Furniture | $32,333 |
| Small Wares | $21,000 |
| Signage | $38,000 to $100,000 |
| Administrative and Miscellaneous: Pre-opening Advertising, Deposits (rent, utilities, and sales tax) | $5,000 to $20,000 |
| Licenses and Interim Interest Payments | $10,000 to $125,000 |
| Pre-opening training personnel from existing Delis | As incurred |
| Insurance | $4,500 to $15,000 |
| Online Ordering Set-Up Costs and Monthly Hosting | $250 per store and $272 monthly per store |
| Point-Of-Sale System | $4,000 to $6,000 per store & $600 to $700 monthly per store |
| Loyalty Platform Software | $60 monthly per store |
| Delivery Fleet Management | $65 monthly (no set up fee) |
| System Email | $150 per user account per year |
| Initial Inventory | $32,925 |
| Additional Funds – 3 months | $20,000 to $35,000 |
| TOTAL | $1,719,656 to $2,529,256 |
Jason’s Deli Franchise Disclosure Document
Frequently Asked Questions
How many Jason’s Deli locations are there?
As of the latest data, Jason’s Deli operates a total of 236 locations across the United States. The majority of these are company-owned, with franchisees operating a smaller portion of the units.
What is the total investment required to open a Jason’s Deli franchise?
The total investment required to open a Jason’s Deli franchise ranges from $1,720,000 to $2,529,000.
What are the ongoing fees for a Jason’s Deli franchise?
A Jason’s Deli franchise requires a 5% royalty fee on gross sales, supporting brand management and operational assistance. Additionally, franchisees pay a 1.5% marketing fee, which funds national and regional advertising efforts to promote the brand and drive customer traffic.
What are the financial requirements to become a Jason’s Deli franchisee?
To become a Jason’s Deli franchisee, applicants need a minimum net worth of $1 million, demonstrating their financial stability to support the franchise. Additionally, a liquid capital requirement of at least $250,000 is necessary to cover initial operational costs and ensure adequate cash flow.
Who owns Jason’s Deli?
Jason’s Deli is owned by Deli Management, Inc., a family-owned company originally founded by Joe Tortorice Jr. in 1976.
Disclaimer
Disclaimer: This content has been made for informational and educational purposes only. SharpSheets is an independent educational resource and is not affiliated with, endorsed by, or representing any franchisor mentioned on this website. Where noted, figures are taken from the franchisor’s Franchise Disclosure Document (FDD). In some cases, we may provide independent calculations or estimates based on publicly available information. We do not make any representation or warranties with respect to the accuracy, applicability, fitness, or completeness of the information presented in the article. You should not construe any such information or other material as legal, tax, investment, financial, or other professional advice. Nothing contained in this article constitutes a solicitation, recommendation, endorsement, advertisement, or offer to buy or sell any franchises, securities, or other financial instruments in this or in any other jurisdiction in which such solicitation or offer would be unlawful under the franchise and/or securities laws of such jurisdiction.
All content in this article is information of a general nature and does not address the detailed circumstances of any particular individual or entity. Nothing in the article constitutes professional and/or financial and/or legal advice, nor does any information in the article constitute a comprehensive or complete statement of the matters discussed or the law relating thereto. You alone assume the sole responsibility of evaluating the merits and risks associated with the use of any information or other content in this article before making any decisions based on such information or other content.


