
Jimmy John’s Franchise FDD, Profits & Costs (2025)
Jimmy John’s, a top sandwich franchise, was founded in 1983 by a 19-year-old in Charleston, Illinois. The goal was simple: offer freshly made sandwiches with high-quality ingredients.
The brand started franchising in 1994, opening doors for entrepreneurs to join its rapid growth. Today, Jimmy John’s is one of the fastest-growing franchises in the U.S.
Known for simplicity and speed, Jimmy John’s menu features a straightforward selection of sandwiches with minimal ingredients. Its fast, efficient delivery system ensures fresh, quick service, distinguishing it in the competitive fast-food market.

Initial Investment
How much does it cost to start a Jimmy John’s franchise? It costs on average between $366,000 – $728,0000 to start a Jimmy John’s franchised restaurant.
This includes costs for construction, equipment, inventory, and initial operating expenses. The exact amount depends on various factors, including the type of restaurant you choose, the location, and whether the franchisee chooses to lease or purchase the property.
| Type of Expenditure | Amount |
|---|---|
| Initial Franchise Fee | $35,000 |
| Real Estate/Rent (1 month) | $2,500 – $8,000 |
| Security Deposit | $2,500 – $8,000 |
| Leasehold Improvements | $115,000 – $310,000 |
| Furniture, Fixtures, Signage, and Equipment | $120,000 – $215,000 |
| Architect/Design Services | $9,500 – $22,000 |
| Office Equipment | $2,200 |
| Utility Deposits | $1,000 – $2,000 |
| Opening Inventory and Supplies | $6,000 |
| Grand Opening Event | $3,000 – $5,000 |
| Training Expenses | $6,000 – $15,000 |
| Insurance | $11,500 – $15,000 |
| Miscellaneous Expenses | $2,000 – $10,000 |
| Additional Funds – 3 months | $50,000 – $75,000 |
| Total Estimated Initial Investment | $366,200 – $728,200 |
Average Revenue (AUV)
How much revenue can you make with a Jimmy John’s franchise? A Jimmy John’s franchised restaurant makes on average $935,000 in revenue (AUV) per year.
Here is the extract from the Franchise Disclosure Document:
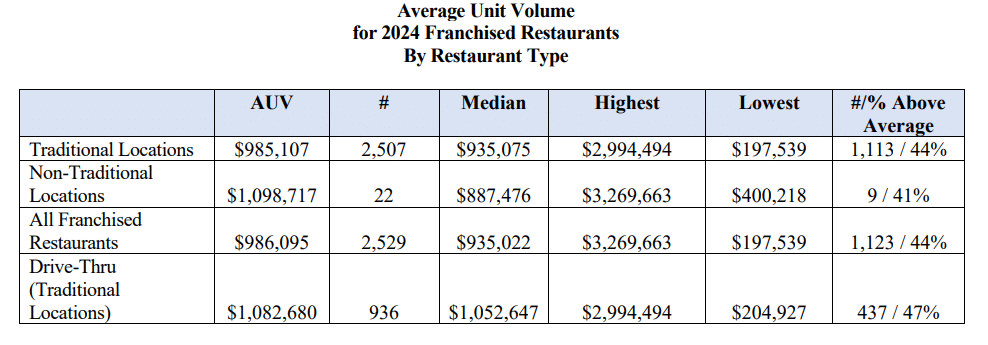
Jimmy John's Franchise Disclosure Document
Frequently Asked Questions
How many Jimmy John’s locations are there?
As of the latest data, Jimmy John’s operates 2,689 locations across the United States. This includes a mix of franchise-owned and company-owned outlets, with Illinois being home to the most stores, representing about 11% of all locations.
What is the total investment required to open a Jimmy John’s franchise?
The total investment required to open a Jimmy John’s franchise ranges from $366,000 to $728,000.
What are the ongoing fees for a Jimmy John’s franchise?
For a Jimmy John’s franchise, ongoing fees include a royalty fee of 6% of gross sales. This fee supports the brand’s ongoing operations and maintenance of its high standards across all locations.
In addition to the royalty fee, franchisees must also pay a brand fund fee of 2% of gross sales, which contributes to national and regional advertising efforts to promote the brand and attract customers.
These fees are standard for maintaining the franchise system’s quality and visibility, providing franchisees with consistent marketing support and operational guidance.
Who owns Jimmy John’s?
Jimmy John’s is owned by Inspire Brands, a major restaurant holding company that acquired the sandwich chain in 2019. Inspire Brands also owns other well-known restaurant chains like Arby’s, Sonic, and Buffalo Wild Wings.
Disclaimer
Disclaimer: This content has been made for informational and educational purposes only. SharpSheets is an independent educational resource and is not affiliated with, endorsed by, or representing any franchisor mentioned on this website. Where noted, figures are taken from the franchisor’s Franchise Disclosure Document (FDD). In some cases, we may provide independent calculations or estimates based on publicly available information. We do not make any representation or warranties with respect to the accuracy, applicability, fitness, or completeness of the information presented in the article. You should not construe any such information or other material as legal, tax, investment, financial, or other professional advice. Nothing contained in this article constitutes a solicitation, recommendation, endorsement, advertisement, or offer to buy or sell any franchises, securities, or other financial instruments in this or in any other jurisdiction in which such solicitation or offer would be unlawful under the franchise and/or securities laws of such jurisdiction.
All content in this article is information of a general nature and does not address the detailed circumstances of any particular individual or entity. Nothing in the article constitutes professional and/or financial and/or legal advice, nor does any information in the article constitute a comprehensive or complete statement of the matters discussed or the law relating thereto. You alone assume the sole responsibility of evaluating the merits and risks associated with the use of any information or other content in this article before making any decisions based on such information or other content.


