Johnny Rockets Franchise FDD, Profits & Costs (2025)
Johnny Rockets, an iconic hamburger restaurant franchise known for its high-quality, innovative menu items, was founded in 1986 on the bustling Melrose Avenue in Los Angeles, California. With a mission to transform meals into unforgettable experiences, Johnny Rockets creates a retro-inspired atmosphere that harks back to the classic American diners of the 1950s.
The brand’s menu features made-to-order Certified Angus Beef® hamburgers, veggie burgers, chicken sandwiches, crispy fries, and rich, hand-spun shakes and malts, served in an upbeat setting that celebrates the joy of simply good times. Headquartered in Aliso Viejo, California, the franchise started its franchising journey in 1987.
The namesake “Johnny Rockets” combines all things Americana: “Johnny” after the iconic Johnny Appleseed, and “Rocket” for the classic Oldsmobile Rocket 88, reflecting the brand’s deep-rooted American charm and retro appeal.
From the beginning, Johnny Rockets incorporated vintage jukebox tunes and service with a smile, quickly becoming a hit with crowds flocking to the original Melrose location.

Initial Investment
How much does it cost to start a Johnny Rockets franchise? It costs on average between $507,000 – $1,686,000 to start a Johnny Rockets franchised restaurant.
This includes costs for construction, equipment, inventory, and initial operating expenses. The exact amount depends on various factors, including the type of restaurant you choose, the location, and whether the franchisee chooses to lease or purchase the property.
| Type of Expenditure | Amount |
|---|---|
| Initial Fee | $50,000 |
| Leasehold Improvements; Construction Costs | $150,000 – $600,000 |
| Equipment, Decor & Furnishings | $160,000 – $600,000 |
| Signage | $10,000 – $100,000 |
| Point of Sale Systems (POS) and related technology | $14,638 – $20,988 |
| Restaurant Small Wares | $10,800 – $25,000 |
| Initial Inventory | $7,200 – $10,400 |
| Security Deposits (Utilities, Insurance, etc.) | $9,000 – $32,500 |
| Insurance and Bonds | $8,000 – $12,000 |
| Rent | $3,500 – $20,000 |
| Miscellaneous (legal, accounting, licenses, permits) | $14,000 – $25,000 |
| Liquor Licenses and Fees | $5,000 – $75,000 |
| Grand Opening & Marketing Materials | $7,500 – $10,000 |
| Training | $32,500 – $65,000 |
| Additional Funds – three months | $25,000 – $40,000 |
| Total | $507,000 – $1,686,000 |
Average Revenue (AUV)
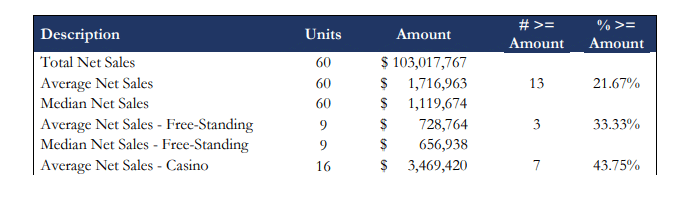
How much revenue can you make with a Johnny Rockets franchise? A Johnny Rockets franchised restaurant makes on average $1,120,000 in revenue (AUV) per year.
Here is the extract from the Franchise Disclosure Document:
This compares to $1,548,000 yearly revenue for similar burger franchises. Below are 10 Johnny Rockets competitors as a comparison:
Download the Franchise Disclosure Document
Frequently Asked Questions
How many Johnny Rockets locations are there?
As of the latest data, Johnny Rockets operates 126 locations across the United States. The state with the highest number of outlets is Florida, hosting 23 locations, which accounts for approximately 18% of the total U.S. presence.
What is the total investment required to open a Johnny Rockets franchise?
The total investment required to open a Johnny Rockets franchise ranges from $507,000 to $1,686,000.
What are the ongoing fees for a Johnny Rockets franchise?
Johnny Rockets franchisees pay a 6% royalty fee on net sales, due weekly. Additionally, they contribute 2% of net sales to the marketing fund and are required to spend another 2% on local advertising biannually.
What are the financial requirements to become a Johnny Rockets franchisee?
To qualify as a Johnny Rockets franchisee, franchisees are required to have a minimum net worth of $500,000 and at least $200,000 in liquid capital. These financial thresholds ensure that franchisees possess the necessary resources to establish and operate a Johnny Rockets restaurant effectively.
How much can a Johnny Rockets franchise owner expect to earn?
The average gross sales for a Johnny Rockets franchise are approximately $1.12 million per location. Assuming a 15% operating profit margin, $1.12 million yearly revenue can result in $168,000 EBITDA annually.
Who owns Johnny Rockets?
Johnny Rockets is owned by FAT Brands Inc., a multi-brand restaurant operator based in Beverly Hills, California. FAT Brands acquired Johnny Rockets in August 2020 for $25 million, expanding its portfolio to include this iconic diner-style chain.
Disclaimer
Disclaimer: This content has been made for informational and educational purposes only. We do not make any representation or warranties with respect to the accuracy, applicability, fitness, or completeness of the information presented in the article. You should not construe any such information or other material as legal, tax, investment, financial, or other professional advice. Nothing contained in this article constitutes a solicitation, recommendation, endorsement, advertisement, or offer to buy or sell any franchises, securities, or other financial instruments in this or in any other jurisdiction in which such solicitation or offer would be unlawful under the franchise and/or securities laws of such jurisdiction.
All content in this article is information of a general nature and does not address the detailed circumstances of any particular individual or entity. Nothing in the article constitutes professional and/or financial and/or legal advice, nor does any information in the article constitute a comprehensive or complete statement of the matters discussed or the law relating thereto. You alone assume the sole responsibility of evaluating the merits and risks associated with the use of any information or other content in this article before making any decisions based on such information or other content.