Nekter Juice Bar Franchise FDD, Profits & Costs (2025)
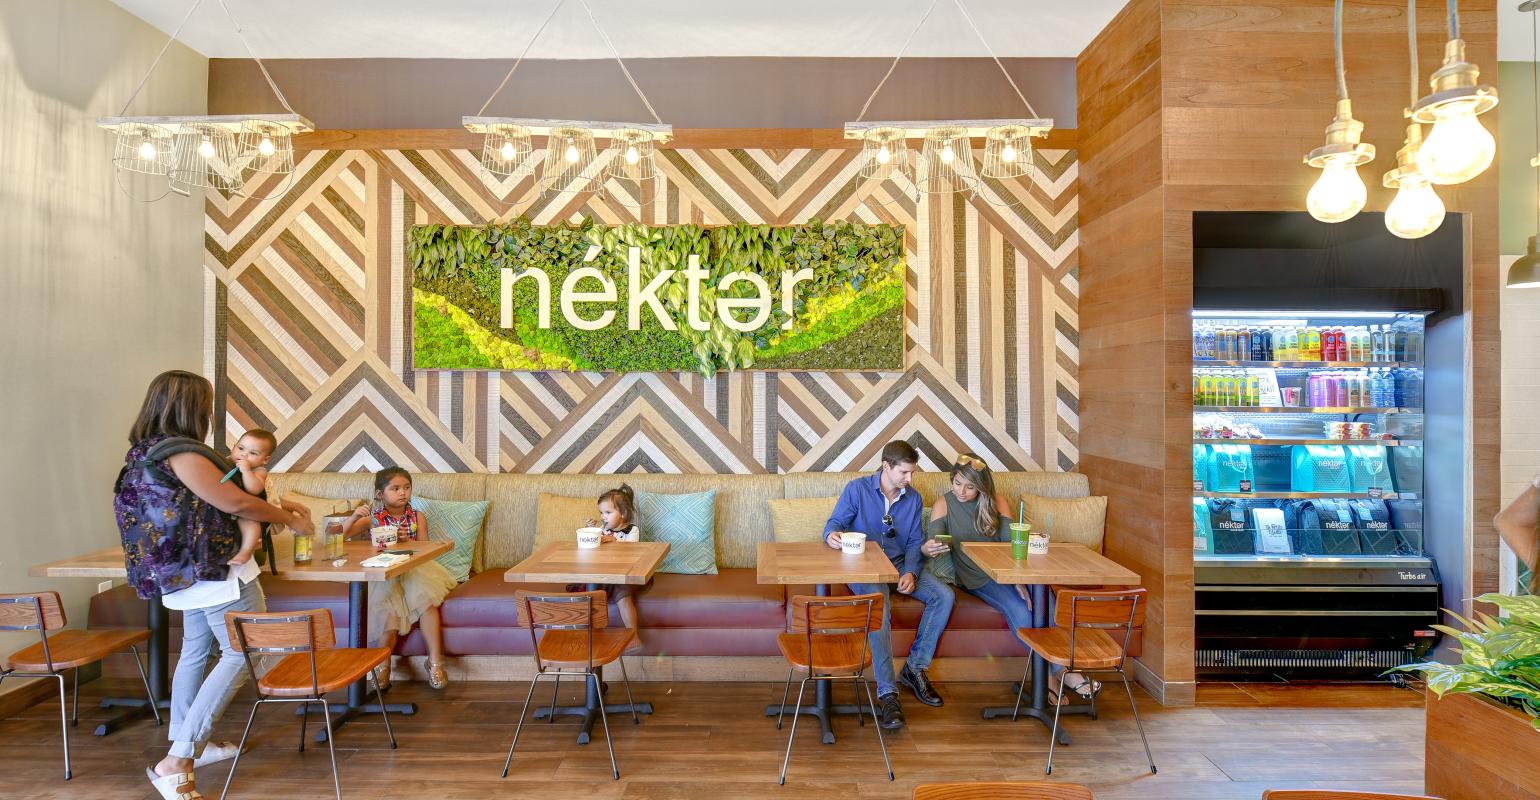
Nékter Juice Bar was founded in 2010 and is headquartered in Costa Mesa, California. The brand is dedicated to providing healthy, affordable, and delicious products. Nékter began franchising after building a strong brand presence.
It offers fresh juices, smoothies, acai bowls, and cleanses, standing out by using transparent ingredients without artificial flavors, fillers, or added sugars.
Nékter Juice Bar promotes a welcoming atmosphere focused on health and wellness. Its mission is to make healthy living accessible and enjoyable.
With over 200 locations nationwide, Nékter is expanding by partnering with franchisees who share its passion for health. The brand’s innovative, customizable menu options appeal to a wide range of dietary needs.

Initial Investment
How much does it cost to start a Nékter Juice Bar franchise? It costs on average between $226,000 – $685,000 to start a Nékter Juice Bar franchised restaurant.
This includes costs for construction, equipment, inventory, and initial operating expenses. The exact amount depends on various factors, including the type of restaurant you choose, the location, and whether the franchisee chooses to lease or purchase the property.
| Type of Expenditure | Amount |
|---|---|
| Initial Franchise Fee; Development Fee | $35,000 to $130,000 |
| Real Estate and Rent – 3 months | $10,000 to $45,000 |
| Real Estate Construction and Improvements | $60,000 to $277,000 |
| Architect | $9,000 to $16,000 |
| Mill Work | $15,000 to $20,000 |
| Fixtures and Furnishings | $4,000 to $13,000 |
| Equipment | $50,000 to $75,000 |
| Signage | $3,500 to $15,000 |
| POS, Security System, Music, Phones, Gift Card and Loyalty Programs, and Computer Systems | $4,700 to $10,000 |
| Miscellaneous Opening Costs | $500 to $1,000 |
| Opening Inventory | $8,000 to $12,000 |
| Uniforms | $300 to $600 |
| Training | $2,500 to $4,000 |
| Grand Opening Marketing | $8,000 to $10,000 |
| Utilities | $2,500 to $4,000 |
| Professional Fees | $2,500 to $6,000 |
| Insurance – 3 Months | $500 to $1,000 |
| Additional Funds – 3 Months | $10,000 to $45,000 |
| Total | $226,000 to $684,600 |
Average Revenue (AUV)
How much revenue can you make with a Nékter Juice Bar franchise? A Nékter Juice Bar franchised restaurant makes on average $603,000 in revenue (AUV) per year.
Here is the extract from the Franchise Disclosure Document:
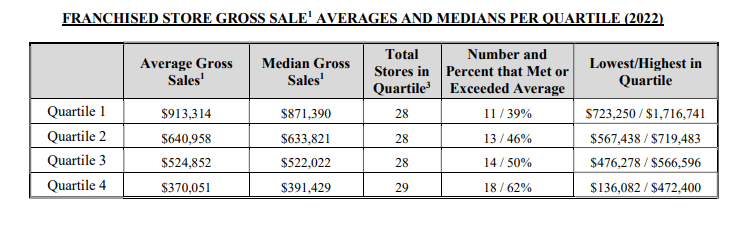
This compares to $603,000 yearly revenue for similar healthy franchises. Below are 10 Nékter Juice Bar competitors as a comparison:

Download the Franchise Disclosure Document
Frequently Asked Questions
How many Nékter Juice Bar locations are there?
As of the latest data, Nékter Juice Bar operates 210 locations across 26 U.S. states. Of these, the majority are franchise-owned units, while a smaller number are company-owned.
The franchise system has been growing steadily, with the brand planning to open an additional 50 locations by the end of the year, which would bring the total number of stores to over 250.
What is the total investment required to open a Nékter Juice Bar franchise?
The total investment required to open a Nékter Juice Bar franchise ranges from $226,000 to $685,000.
What are the ongoing fees for a Nékter Juice Bar franchise?
Nékter Juice Bar franchisees are required to pay a royalty fee set at 6% of gross sales, which goes toward the franchisor’s ongoing assistance, including operational support and the maintenance of the brand’s standards.
Additionally, franchisees contribute 4% of their gross sales toward advertising fees. This fee supports both national and local marketing initiatives, helping to drive brand awareness and customer engagement across all locations.
What are the financial requirements to become a Nékter Juice Bar franchisee?
To become a Nékter Juice Bar franchisee, the financial requirements include:
- Minimum Net Worth: $500,000
- Liquid Assets: At least $150,000
These financial criteria ensure that potential franchisees have the necessary resources to invest in the business and manage ongoing operations effectively.
How much can a Nékter Juice Bar franchise owner expect to earn?
The average gross sales for a Nékter Juice Bar franchise are approximately $0.6 million per location. Assuming a 15% operating profit margin, $0.6 million yearly revenue can result in $90,000 EBITDA annually.
Who owns Nékter Juice Bar?
Nékter Juice Bar is owned by Steve Schulze, who co-founded the company in 2010 alongside his wife, Alexis Schulze. Steve Schulze serves as the CEO, leading the company’s growth and expansion across the U.S.
Disclaimer
Disclaimer: This content has been made for informational and educational purposes only. We do not make any representation or warranties with respect to the accuracy, applicability, fitness, or completeness of the information presented in the article. You should not construe any such information or other material as legal, tax, investment, financial, or other professional advice. Nothing contained in this article constitutes a solicitation, recommendation, endorsement, advertisement, or offer to buy or sell any franchises, securities, or other financial instruments in this or in any other jurisdiction in which such solicitation or offer would be unlawful under the franchise and/or securities laws of such jurisdiction.
All content in this article is information of a general nature and does not address the detailed circumstances of any particular individual or entity. Nothing in the article constitutes professional and/or financial and/or legal advice, nor does any information in the article constitute a comprehensive or complete statement of the matters discussed or the law relating thereto. You alone assume the sole responsibility of evaluating the merits and risks associated with the use of any information or other content in this article before making any decisions based on such information or other content.