
Perkins Franchise FDD, Profits & Costs
Perkins franchise, with its roots stretching back to 1958, stands as a testament to an enduring American culinary tradition.
Initially founded as a pancake house, Perkins has expanded its menu over the decades to include a wide array of breakfast, lunch, and dinner options, catering to a broad customer base with its classic comfort foods and contemporary culinary specialties.
Headquartered in Atlanta, GA, the chain began franchising, marking the start of its expansion and evolution into the Perkins Restaurant & Bakery known today.
The franchise is renowned not just for its all-day breakfast offerings but also for its in-house bakery, which contributes significantly to its appeal by providing a variety of pies, muffins, and other baked goods, made fresh daily.

Initial Investment
How much does it cost to start a Perkins franchise? It costs on average between $1,184,000 – $3,290,000 to start a Perkins franchised restaurant.
This includes costs for construction, equipment, inventory, and initial operating expenses. The exact amount depends on various factors, including the type of restaurant you choose, the location, and whether the franchisee chooses to lease or purchase the property. Perkins offers 2 types of franchises:
| Franchise Type | Initial Investment Range |
|---|---|
| Perkins Restaurant and Bakery (Nontraditional Location) | $1,183,715 – $2,836,465 |
| Perkins Restaurant and Bakery (Leasing land/building and purchasing equipment/signs) | $1,534,715 – $3,290,465 |
We are summarizing below the main costs associated with opening a Perkins Restaurant and Bakery (Leasing land/building and purchasing equipment/signs). For more information on the costs required to start a Perkins franchise, refer to the Franchise Disclosure Document (Item 7).
| Type of Expenditure | Amount (Traditional Franchise) |
|---|---|
| Initial Franchise Fee | $40,000 |
| Training Fee and Travel and Living Expenses While Training | $97,000 – $119,000 |
| Real Estate – Rent for First 3 months | $20,000 – $60,000 |
| Improvements | $575,000 – $1,967,000 |
| Interest during construction | $25,000 – $30,000 |
| Equipment and Seating | $490,000 – $650,000 |
| Signs and Décor | $53,000 – $82,000 |
| Site Plan/Engineering Drawings | $12,500 – $18,500 |
| Travel Expenses for Opening Guide Meeting | $0 – $750 |
| Smallwares, Small equipment, Opening Inventory and Uniforms | $53,000 – $82,000 |
| POS System | $15,000 – $20,000 |
| Help Desk (total for first 3 months) | $215 – $215 |
| Hardware and Software Components – Computer Security | $2,500 – $3,000 |
| Other Computer and Technology Expenses (first 3 months) | $2,500 – $3,000 |
| Grand Opening Promotion | $4,000 – $10,000 |
| Miscellaneous Opening Costs | $45,000 – $55,000 |
| Additional Funds-3 Months | $100,000 – $150,000 |
| Total | $1,534,000 – $3,290,000 |
Average Revenue (AUV)
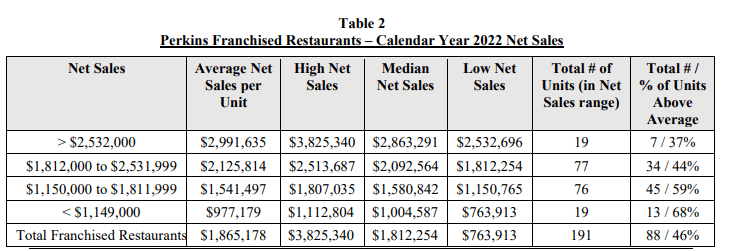
How much revenue can you make with a Perkins franchise? A Perkins franchised restaurant makes on average $1,812,000 in revenue (AUV) per year.
Here is the extract from the Franchise Disclosure Document:
Perkins Franchise Disclosure Document
Frequently Asked Questions
What funding options are available for a Perkins franchise?
Most franchise buyers in Perkins’s investment range finance their unit through an SBA 7(a) loan, with some multi-unit operators using SBA 504 loans for real estate. Buyers with rollable retirement funds sometimes use a ROBS structure to reduce debt service. See SharpSheets’ financial model hub for funding guidance.
How long does it take to pay back a Perkins franchise investment?
Payback periods for franchises in Perkins’s category typically run 3-7 years, depending on investment level, location performance, and financing structure. Actual payback varies significantly by unit performance and debt service obligations.
Who owns Perkins?
Perkins Restaurant & Bakery is owned by Ascent Hospitality Management, an Atlanta-based company that also owns Huddle House. Ascent acquired Perkins in 2019 with the intent to manage and grow both brands while keeping them distinct in their operations and identity.
SharpSheets Editorial Team | sharpsheets.io | Last Updated: June 2026
Disclaimer
Disclaimer: This content has been made for informational and educational purposes only. SharpSheets is an independent educational resource and is not affiliated with, endorsed by, or representing any franchisor mentioned on this website. Where noted, figures are taken from the franchisor’s Franchise Disclosure Document (FDD). In some cases, we may provide independent calculations or estimates based on publicly available information. We do not make any representation or warranties with respect to the accuracy, applicability, fitness, or completeness of the information presented in the article. You should not construe any such information or other material as legal, tax, investment, financial, or other professional advice. Nothing contained in this article constitutes a solicitation, recommendation, endorsement, advertisement, or offer to buy or sell any franchises, securities, or other financial instruments in this or in any other jurisdiction in which such solicitation or offer would be unlawful under the franchise and/or securities laws of such jurisdiction.
All content in this article is information of a general nature and does not address the detailed circumstances of any particular individual or entity. Nothing in the article constitutes professional and/or financial and/or legal advice, nor does any information in the article constitute a comprehensive or complete statement of the matters discussed or the law relating thereto. You alone assume the sole responsibility of evaluating the merits and risks associated with the use of any information or other content in this article before making any decisions based on such information or other content.
Research Perkins franchise data: For the full FDD cost breakdown, investment tables, and Item 19 disclosures, visit FranchisePayback.com → Perkins FDD Review.


