
How Profitable is a Pharmacy? Break-even & Profits Analysis

If you are planning to open a pharmacy, you need to understand how you can turn your revenues into profits. In other words, you must know how much revenue you must generate to reach break-even and make profits.
According to Fortune Business Insights, the US pharmacy market is expected to grow from $534 billion in 2020 to reach a whopping $862 billion by 2028 (+6.3% CAGR).
Although strictly regulated, the pharmacy business can be very profitable if run correctly. In this article we’ll look at how much turnover, costs and profits you can generate with a pharmacy in the US. Let’s dive in!
What is the average turnover for a pharmacy?
According to PBA Health, the average annual turnover of independent pharmacies in the US was $3,459,814 in year 2020. It’s an increase of $1.7% vs. 2019.
When it comes to pharmacy owners, Drug Channels revealed that their annual average take-home salary was $158,000 in 2020 (vs. $141,000 in 2019).
What is the average profit margin for pharmacy?
PBA Health reports that the average pharmacy profit margin dipped slightly from 22% in 2019 to 21.9% in 2020.
In other words, pharmacies realise a net profit of $75,755 per year on average. This is the net profit after all costs (COGS, salaries, rent, etc.).
How much does it cost to run a pharmacy?
There are certain recurring costs you need to incur to run a pharmacy efficiently and they include:
- COGS: This is cost for acquiring products (prescription drugs, OTC medicines, cosmetics, etc.) you that you will sell to customers
- Rent: You need to pay rent for the property where you will build your pharmacies
- Salaries: You must pay salaries to your pharmacy staff
- Utility bills: You need to pay utility bills
- Janitorial services: You will require janitorial services to keep your store clean and hygienic
- Insurance: You must purchase business insurance, workers’ compensation insurance, etc.
In general, you will require approximately $143,500 a month to run a pharmacy efficiently.
We’re including below the revenue to profits breakdown chart of a pharmacy generating $3,400,000 in turnover per year (average net profit margin of 15%).

For more information on how much it costs to run a pharmacy, read our article here.
How to forecast profits for a pharmacy?
In order to calculate profits for a pharmacy, you must first forecast revenues and expenses.
Profits = Revenue – Expenses
Forecasting revenue for a pharmacy
Revenue can easily be obtained by multiplying the number of orders by the average order value:
Revenue = Orders x Average order value
For example, if you have 1,000 customers (1,000 orders) in a month paying on average $150, monthly revenue is $150,000.
Forecasting costs for a pharmacy
There are 2 types of expenses for a pharmacy:
- Variable expenses: these are the COGS as explained earlier. They grow in line with your revenue: if your turnover increases by 10%, variable expenses grow by 10% as well
- Fixed expenses: mostly salaries, rental costs and all the other costs listed above
Calculating profits for a pharmacy
When we refer to profits, we usually refer to EBITDA (Earnings before interests, taxes, depreciation and amortization) as it represents the core profitability of the business, excluding things such as debt interests, non cash expenses and other non-core expenses.
In order to get to EBITDA, we use the following formula:
EBITDA = Revenue – COGS – Operating Expenses
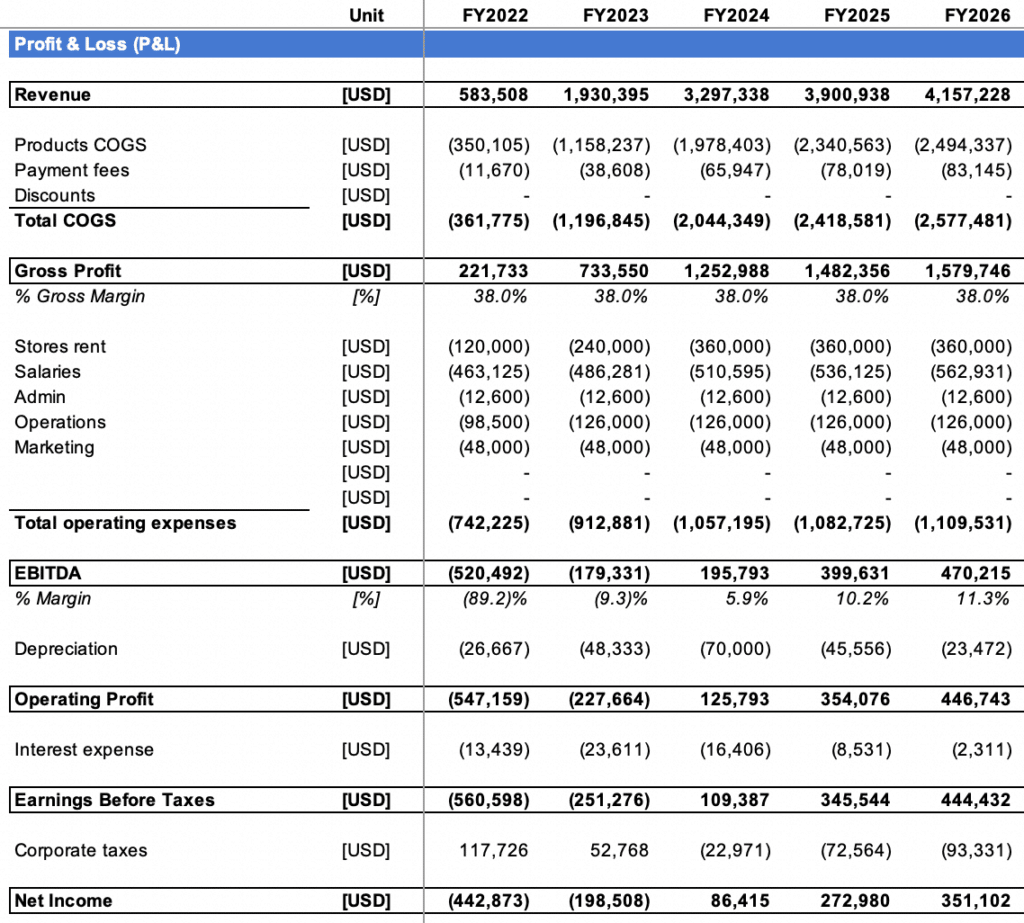
To make it clearer, we’ve included below the profit-and-loss of a pharmacy (from our financial model template for pharmacies).
Whilst gross margin (after variable costs) is rather low (~40%), EBITDA margin can go up to 10-20% depending on the pharmacy.
Want to know how to build a financial projections for a pharmacy? Read our complete guide here.
What is the break-even point for a pharmacy?
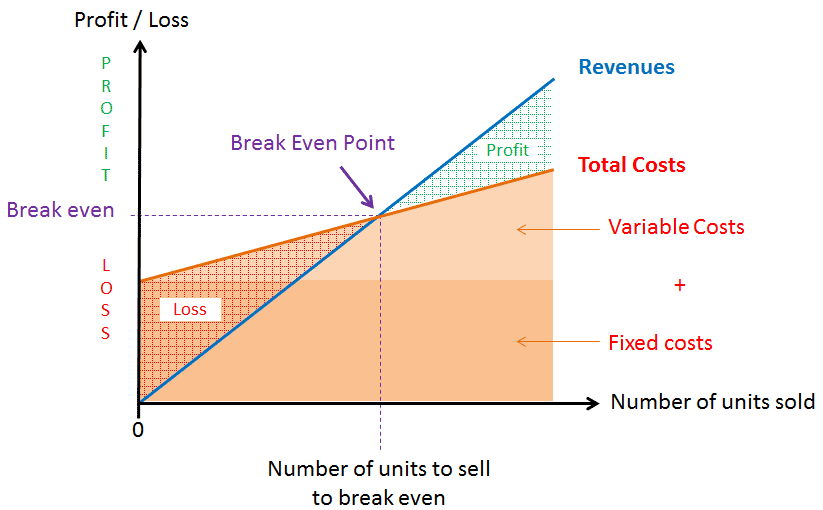
Break-even is the point at which total costs and total revenue are equal. In other words, the breakeven point is the amount of revenue you must generate to turn a profit.
Because you must at least cover all fixed costs (that aren’t a function of revenue) to turn a profit, the break-even point is at least superior to the sum of your fixed costs.
Yet, you also need to spend a certain amount for every $1 of sales to pay for the variable costs. As we just saw, pharmacy have rather low gross margins (~40%). That’s because a significant part of their costs are the cost to source the drugs from the drug manufacturers: these grow in line with sales.
The break-even point can easily be obtained by using the following formula:
Break-even point = Fixed costs / Gross margin
Using the same example earlier, let’s assume a pharmacy has the following cost structure:
| Operating cost | Variable vs. fixed | Amount (per month) |
|---|---|---|
| COGS | Variable cost | $90,000 |
| Staff | Fixed cost | $43,800 |
| Rent and utility bills | Fixed cost | $4,500 |
| Marketing | Fixed cost | $5,000 |
| Other | Fixed cost | $2,000 |
| Total | $143,500 |
The break-even point would then be:
Break-even point = Fixed costs / Gross margin %
= $55,300 / 40% = $138,000
In other words, you need to make at least $138,000 in sales to turn a profit.
How to increase profits for a pharmacy?
Increasing pharmacy profits is not easy. However, there are certain strategies that you can implement to increase the profits for a pharmacy, and they include:
- Sell OTC drugs: OTC drugs are a good way to increase revenue, but you must place them strategically
- Sell bundled products: If you sell beauty products, consider bundling them
- Upsell: Train your staff to upsell products (usually OTC health & wellness products)
- Use customer loyalty programs: A loyalty program helps to retain customers and increase their lifetime value.
- Expand services: Include things like home delivery, prescription filling reminders, online ordering, etc.
- Maintain a blog: This can help to drive traffic to your online store
Learn about these strategies in details in our article here.

Pharmacy Financial Model Template | Excel Spreadsheet
Download an expert-built 5-year Excel financial model for your business plan
Pharmacy Financial Model Template | Excel Spreadsheet
Download an expert-built 5-year Excel financial model for your business plan