How to Build a Financial Model for a Pharmacy: Complete Guide
Every business needs a budget. Whether you want to understand what’s your breakeven, your valuation or create a financial model for your pharmacy business plan, you’ve come the right way.
In this article we’ll explain you how to create powerful and accurate financial projections for a pharmacy which you can also add to your pharmacy business plan.
For more information on pharmacies, make sure to read our guides below:
How Much Does It Cost To Open a Pharmacy?
How To Open a Pharmacy In 12 Steps
How to Write a Pharmacy Business Plan: Complete Guide
1. Forecast Customers & Transactions
The first thing you need to do is to estimate the number of customers you will acquire, and retain, over time.
The number of customers who make a purchase each month is the result of:
Customers = New customers + Repeat customers
New Customers
New customers are a function of the visitors that enter your pharmacy, and a conversion rate. For example: 500 visitors per week x 50% = 250 transactions a week.
Note: conversion rates for pharmacies are much higher vs. other stores, including retail stores. This is due to the fact that drugs are often staple products (unlike fashion for example) people actually need, and also due to the high percentage of sales that comes from prescription drugs (prescribed by doctors).
Repeat Customers
There are multiple ways to do this. The most accurate (and flexible) is to set a number of assumptions:
- The percentage of your customers who are repeat (those who will buy 2 or more times in their lifetime from your pharmacy)
- The purchase frequency (when they buy again, how many times a year do they do so?)
- The churn rate (they will likely not buy forever, instead they might churn in average after 10 years or so)
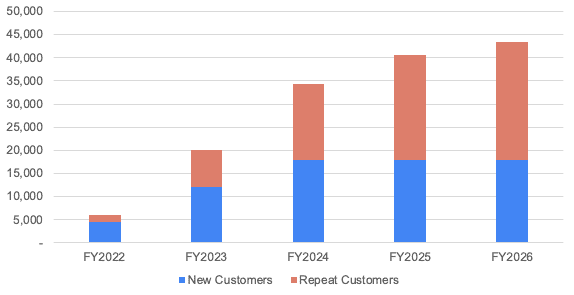
This will allow you to accurately forecast the transactions made by repeat customers in the future and obtain something like the chart below.
Note: in the example below, repeat customers represent 1/3 of total customers. Also, they come back multiple times a year (actually 4 times on average), which explains why the number of transactions from repeat customers grows faster than new customers’ transactions.
2. Forecast Pharmacy Revenue
Once you have estimated the number of transactions, both from new and repeat customers, you can calculate revenue.
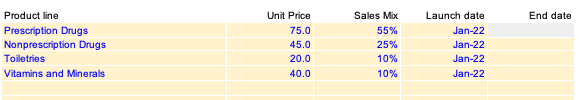
Revenue can be obtained by first segmenting transactions into different product categories (with each different prices and costs) for maximum accuracy.
You can do so by setting percentages for product sales mix as shown below. Note that in this example we’ve also added launch and end dates (if you plan to start and discontinue product lines at different times in the future.
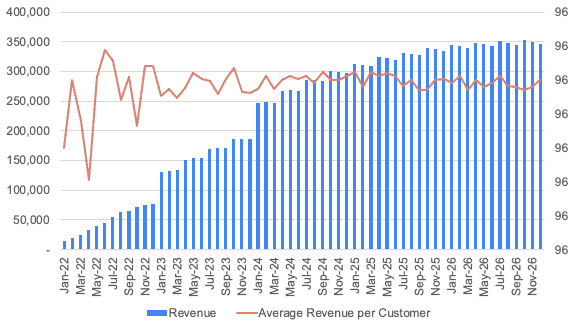
You can now obtain your revenue projections as well as important metrics such as the average revenue per customer as shown below:

Pharmacy Financial Model Template | Excel Spreadsheet
Download an expert-built 5-year Excel financial model for your business plan
Pharmacy Financial Model Template | Excel Spreadsheet
Download an expert-built 5-year Excel financial model for your business plan
3. Forecast Pharmacy Expenses
In addition to the one-off startup costs discussed here, you must also consider the total recurring cost of running a pharmacy. Those expenses include:
The operating costs depend on the type of services you offer and the size of your business. Here’s a brief overview of the operating costs you can expect for a 1,700 sq. ft. independent pharmacy with 6 employees that generates $150,000 in sales per month.
Note that these costs are only for illustrative purposes and might not fully relevant for you. For more information, read our article on how much it costs to open and run a pharmacy.
| Operating cost | Amount (per month) |
|---|---|
| Staff | $43,800 |
| COGS | $90,000 |
| Rent and utility bills | $4,500 |
| Marketing | $5,000 |
| Total | $143,500 |
Staff
Depending on the hourly rate you intend to pay and the number of staff you’ll start with, labor costs can vary significantly.
Whilst a pharmacy technician earns on average $35,000 to $45,000 per year, pharmacists instead earn $106,000 on average.
So assuming you hire 3 pharmacists and 3 technicians, you would be paying $43,800 in salary costs alone per month (including 20% taxes and benefits).

COGS (Cost of Goods Sold)
Often the most important operating cost for pharmacies are the COGS. For pharmacies, COGS are all the costs to purchase inventory itself, so the medication supplies you can sell to customers later on.
As an example, the average cost of products sold by an independent pharmacy in the US is $2,724,000 per year, or $227,000 per month, according to the 2019 NCPA Digest.
Also, statistics from Texas Tech University’s School of Pharmacy show that the cost of goods sold typically accounts for 68% of all operating expenses for a typical pharmacy.
COGS are also very dependent upon the type of medication you sell, for example:
- Branded medicine will have an average profit margin of 16 to 22%
- Generic medicine instead have average profit margins of 20 to 50%
So assuming you generate $150,000 in sales per month and have an average profit margin of 40%, you would spend on average $90,000 in COGS each month (60% of $150,000).
Rent & utility bills
Rent is another of the important expenses you should budget for. Assuming the same example above with 1,700 sq. ft. space at a rate of $27 per sq. ft. in a shopping center, you would be paying over $3,800 in rent each month.
Keep in mind that your pharmacy must have ample space for furniture such as racks, pallets, and refrigerators. The size of your activities will significantly impact how much office space you need for your start-up.
Adding 20-25% for utility bills, you should budget around $4,500 in total per month.
Marketing
On average, retail pharmacies allocate 1.5% to 2% of their gross revenue to marketing. Another survey highlights that hardly half of the independent pharmacies spend more than $5,000 annually on marketing. This includes the cost of billboards, online marketing, etc.
Yet, as you will just be starting off, you should be conservative and assume you may be spending around $5,000 in marketing expenses each month.

4. Build your P&L and Cash Flow
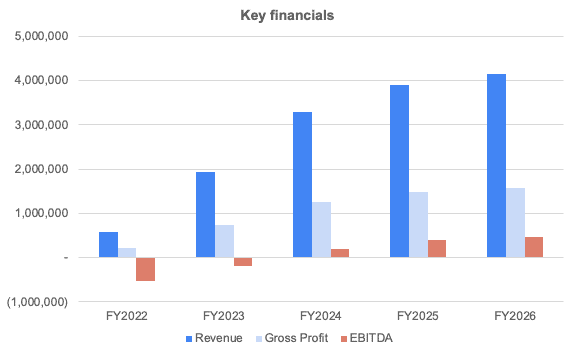
Once we have forecasted revenues and expenses, we can easily build the profit-and-loss (P&L) from revenues down to net profit. This will help you to visualise key financial metrics such as Gross Profit or EBITDA margin as shown below:
The cash flow statement, in comparison, needs to include all cash items from the P&L and other cash movements such as capital investments (also referred as “Capex”), fundraising, debt, etc.
Cash flow is vital as it will help you understand how much funding you should get, either from investors or the bank (SBA loan for example) to start and run your own pharmacy.
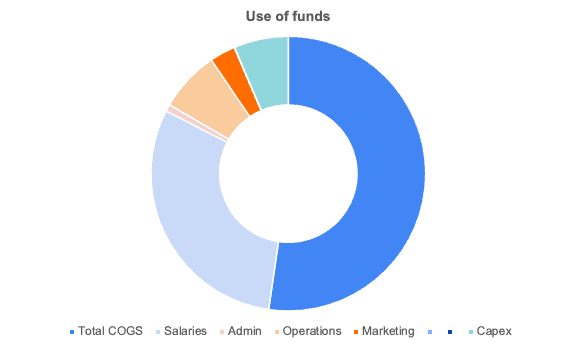
In the chart below, we're showing you an example of a typical cost structure a pharmacy would have, from COGS, marketing, salaries and other expenses. Unsurprisingly, 80% of expenses are the cost to purchase inventory (COGS, ~50%) as well as salaries (~30%).
Pharmacy Financial Model Template | Excel Spreadsheet
Download an expert-built 5-year Excel financial model for your business plan
Pharmacy Financial Model Template | Excel Spreadsheet
Download an expert-built 5-year Excel financial model for your business plan