Rita’s Italian Ice Franchise FDD, Profits & Costs (2025)
Rita’s Italian Ice was founded in 1984 by Bob Tumolo, a former Philadelphia firefighter, who started the business on his front porch and named it after his wife, Rita.
The brand began franchising soon after its launch, gaining popularity for its unique Italian ice and frozen custard treats.
Headquartered in Trevose, Pennsylvania, Rita’s has grown significantly, with locations in over 30 states. The franchise remains a leader in the frozen dessert market, known for its refreshing, high-quality offerings.

Rita’s Italian Ice Franchise Initial Investment
It costs on average between $22,000 – $643,000 to start a Rita’s Italian Ice franchised restaurant.
This includes construction, equipment, inventory, and initial operating expenses. The exact amount depends on various factors, including the type of restaurant you choose, the location, and whether the franchisee leases or purchases the property. Rita’s Italian Ice offers 5 types of franchises:
| Rita’s Shop Type | Initial Investment (Low) | Initial Investment (High) |
|---|---|---|
| Mobile Unit | $21,600 | $175,000 |
| Satellite Shop | $131,550 | $298,500 |
| Express Shop | $199,005 | $558,504 |
| Standard Shop (with drive-thru) | $456,858 | $905,536 |
| Standard Shop (without drive-thru) | $315,233 | $770,542 |
We are summarizing below the main costs associated with opening a Standard Rita’s Italian Ice Shop (with drive-thru) franchise. For more information on the various types of franchises and their costs, refer to the Franchise Disclosure Document (Item 7).
| Type of Expenditure | Amount |
|---|---|
| Initial Franchise Fee | $35,000 |
| Lease Deposit | $0-$12,500 |
| Leasehold Improvements | $212,086-$400,000 |
| Equipment | $123,500-$230,000 |
| Permits & Licenses | $3,042-$10,000 |
| Signage | $19,160-$88,781 |
| Insurance | $200-$3,920 |
| Initial Order | $8,000-$17,500 |
| Minimum New Shop Marketing Expenditure | $12,000 |
| Training | $50-$5,000 |
| Architect and Attorney Fees | $23,820-$60,835 |
| Additional Funds (3 months) | $20,000-$30,000 |
| TOTAL | $456,858-$905,536 |
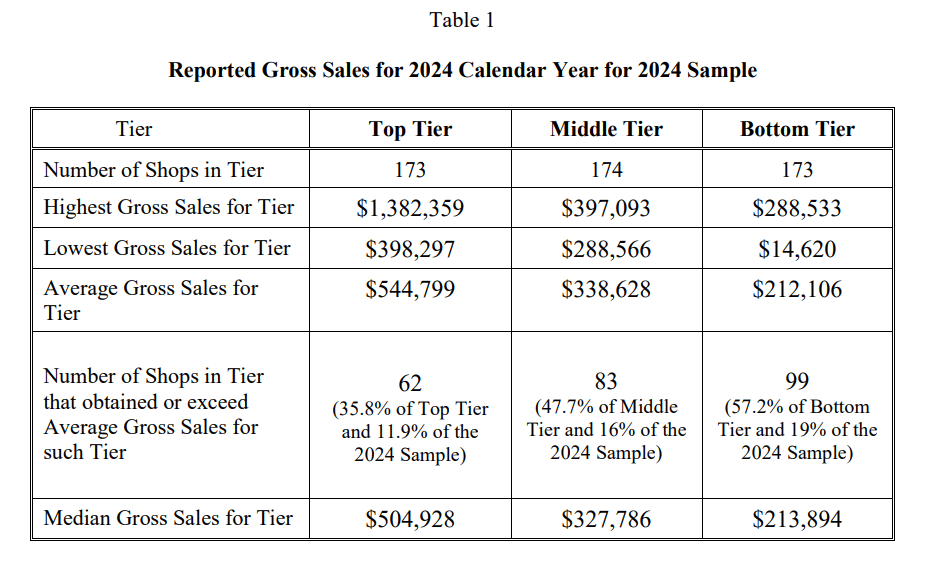
Rita’s Italian Ice Franchise Average Revenue (AUV)
A Rita’s Italian Ice franchised restaurant makes on average $349,000 in revenue (AUV) per year.
Here is the extract from the Franchise Disclosure Document:
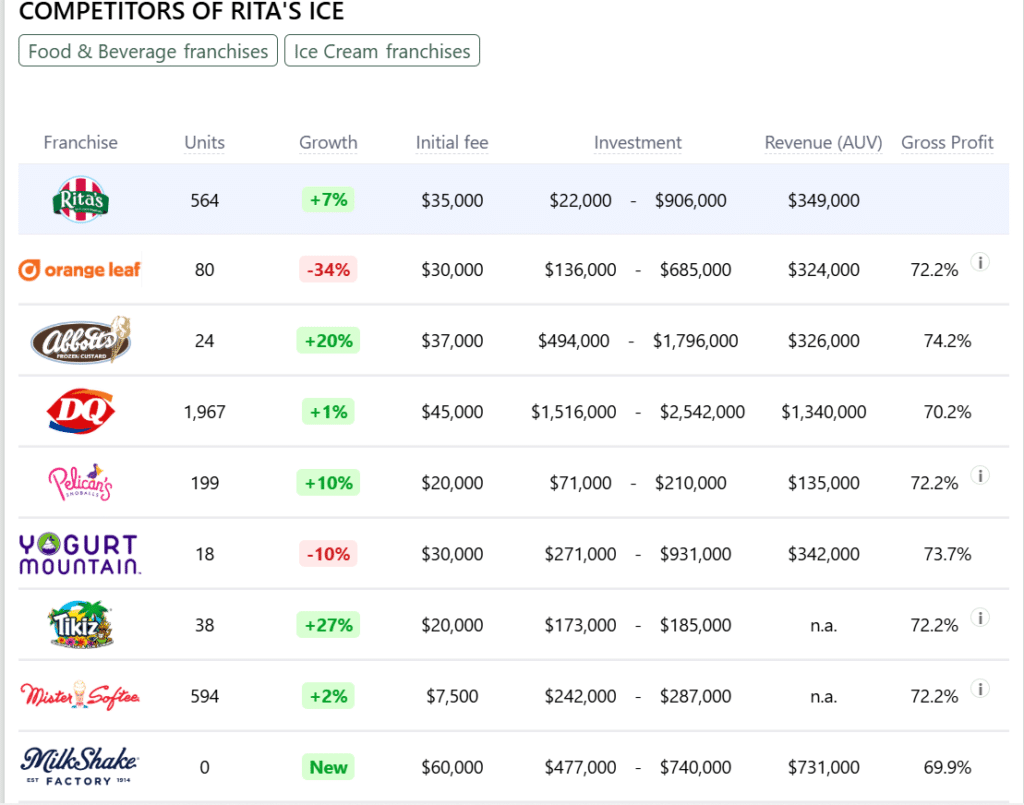
This compares to $515,000 yearly revenue for similar ice cream franchises. Below are 10 Rita’s Italian Ice competitors as a comparison:
Download the Franchise Disclosure Document
Frequently Asked Questions
How many Rita’s Italian Ice locations are there?
As of the latest data, Rita’s Italian Ice operates a total of 569 locations. Of these, 564 are franchised units, while 5 are company-owned.
What is the total investment required to open a Rita’s Italian Ice franchise?
The total investment required to open a Rita’s Italian Ice franchise ranges from $22,000 to $906,000 for the Standard Rita’s Italian Ice Shop (with drive-thru).
What are the ongoing fees for a Rita’s Italian Ice franchise?
Rita’s Italian Ice franchisees are required to pay a 6.5% royalty fee on gross sales. Additionally, there is a marketing fee of 5% of gross sales, which includes contributions towards national and local advertising efforts.
What are the financial requirements to become a Rita’s Italian Ice franchisee?
To become a Rita’s Italian Ice franchisee, you must meet specific financial requirements. These include having a minimum net worth of $300,000 and at least $100,000 in liquid assets. These criteria ensure that franchisees are financially prepared to handle the initial investment,
How much can a Rita’s Italian Ice franchise owner expect to earn?
The average gross sales for a Rita’s Italian Ice franchise are approximately $0.35 million per location. Assuming a 15% operating profit margin, $0.35 million yearly revenue can result in $53,000 EBITDA annually.
Who owns Rita’s Italian Ice?
Rita’s Ice franchise is owned by Maple Park Capital Partners, a private equity firm specializing in consumer businesses. In January 2025, Maple Park Capital Partners acquired a majority stake in Rita’s, which operates over 575 locations across 30 states.
Disclaimer
Disclaimer: This content has been made for informational and educational purposes only. We do not make any representation or warranties with respect to the accuracy, applicability, fitness, or completeness of the information presented in the article. You should not construe any such information or other material as legal, tax, investment, financial, or other professional advice. Nothing contained in this article constitutes a solicitation, recommendation, endorsement, advertisement, or offer to buy or sell any franchises, securities, or other financial instruments in this or in any other jurisdiction in which such solicitation or offer would be unlawful under the franchise and/or securities laws of such jurisdiction.
All content in this article is information of a general nature and does not address the detailed circumstances of any particular individual or entity. Nothing in the article constitutes professional and/or financial and/or legal advice, nor does any information in the article constitute a comprehensive or complete statement of the matters discussed or the law relating thereto. You alone assume the sole responsibility of evaluating the merits and risks associated with the use of any information or other content in this article before making any decisions based on such information or other content.