Robeks Franchise FDD, Profits & Costs (2025)
Robeks is a notable player in the fast-casual franchise market, specializing in smoothies, fresh juices, and acai bowls. With a strong focus on health and nutrition, Robeks has carved out a significant niche in the $2 billion annual sales market for smoothie and juice franchises.
The brand, which began franchising its concept in 2001, prides itself on its straightforward and quality-driven offerings, mirroring the simplicity and health focus of its menu items.
Founded in 1996 and headquartered in Los Angeles, California, Robeks has grown offering a range of freshly prepared beverages and snacks that cater to health-conscious consumers.
Robeks differentiates itself in the competitive landscape with its commitment to fresh, high-quality ingredients, eschewing the use of artificial additives and preservatives.
The franchise model appeals to entrepreneurs who are passionate about healthy living and wish to make a positive impact on their communities by promoting healthier eating habits.

Initial Investment
How much does it cost to start a Robeks franchise? It costs on average between $320,000 – $484,000 to start a Robeks franchised restaurant.
This includes costs for construction, equipment, inventory, and initial operating expenses. The exact amount depends on various factors, including the type of restaurant you choose, the location, and whether the franchisee chooses to lease or purchase the property.
| Type of Expenditure | Amount |
|---|---|
| Initial Franchise Fee | $30,000 |
| Leasehold Improvements | $130,000 – $200,000 |
| Equipment | $90,500 – $128,000 |
| Fixtures | $19,000 – $29,000 |
| Signs | $5,000 – $14,000 |
| Computer System | $4,500 – $7,000 |
| Professional Fees | $12,000 – $18,700 |
| Deposits and Business Licenses | $5,000 – $11,000 |
| Real Estate Costs | $3,500 – $5,400 |
| Opening Inventory | $7,200 – $10,000 |
| Grand Opening Advertising | $5,000 – $7,500 |
| Travel for Training | $0 – $5,000 |
| Insurance | $1,200 – $3,800 |
| Additional Funds – 3 months | $7,500 – $15,000 |
| Total | $320,400 – $484,400 |
Average Revenue (AUV)
How much revenue can you make with a Robeks franchise? A Robeks franchised restaurant makes on average $666,000 in revenue (AUV) per year.
Here is the extract from the Franchise Disclosure Document:
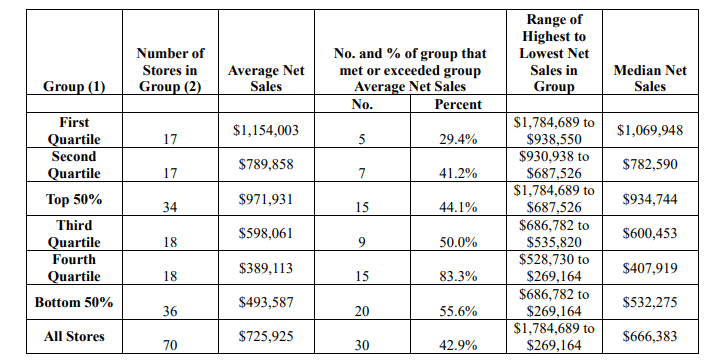
This compares to $603,000 yearly revenue for similar healthy franchises. Below are 10 Robeks competitors as a comparison:
Download the Franchise Disclosure Document
Frequently Asked Questions
How many Robeks locations are there?
As of the latest data, Robeks has over 100 franchise locations across the United States. The company operates primarily through franchised stores, with only a small number of company-owned units, which allows for broader franchisee involvement in its operations.
What is the total investment required to open a Robeks franchise?
The total investment required to open a Robeks franchise ranges from $320,000 to $484,000.
What are the ongoing fees for a Robeks franchise?
Robeks franchisees are required to pay a royalty fee of 6.25% to 7% of gross sales, paid regularly to the franchisor to cover brand usage, operational support, and other central services. Additionally, franchisees contribute a marketing fee of 2.5% of their gross sales, which funds national marketing campaigns and brand-building efforts.
What are the financial requirements to become a Robeks franchisee?
To qualify for a Robeks franchise, applicants need a minimum net worth of $300,000 and at least $100,000 in liquid capital. These requirements ensure franchisees have the financial resources necessary to support startup and operational costs effectively.
How much can a Robeks franchise owner expect to earn?
The average gross sales for a Robeks franchise are approximately $0.67 million per location. Assuming a 15% operating profit margin, $0.67 million yearly revenue can result in $100,500 EBITDA annually.
Who owns Robeks?
Robeks is owned by Robeks Corporation, a private company headquartered in California. Founded in 1996, the company remains a prominent player in the smoothie and juice industry, known for its franchise-focused business model that emphasizes healthy, fresh ingredients and high-quality customer service.
Disclaimer
Disclaimer: This content has been made for informational and educational purposes only. We do not make any representation or warranties with respect to the accuracy, applicability, fitness, or completeness of the information presented in the article. You should not construe any such information or other material as legal, tax, investment, financial, or other professional advice. Nothing contained in this article constitutes a solicitation, recommendation, endorsement, advertisement, or offer to buy or sell any franchises, securities, or other financial instruments in this or in any other jurisdiction in which such solicitation or offer would be unlawful under the franchise and/or securities laws of such jurisdiction.
All content in this article is information of a general nature and does not address the detailed circumstances of any particular individual or entity. Nothing in the article constitutes professional and/or financial and/or legal advice, nor does any information in the article constitute a comprehensive or complete statement of the matters discussed or the law relating thereto. You alone assume the sole responsibility of evaluating the merits and risks associated with the use of any information or other content in this article before making any decisions based on such information or other content.