Round Table Pizza Franchise FDD, Profits & Costs (2025)
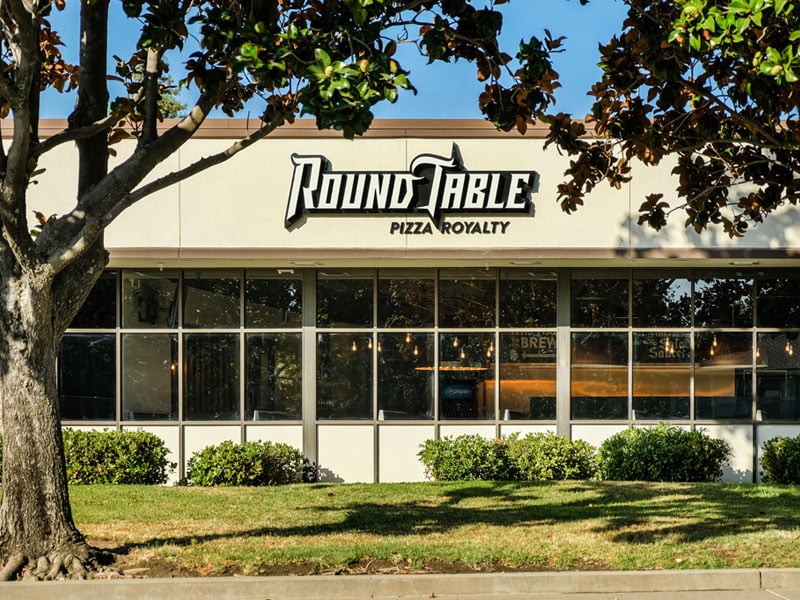
Round Table Pizza, renowned for its commitment to quality and authenticity, has established itself as “Pizza Royalty™” over the past 60 years.
Founded in 1959 by Bill Larson in Menlo Park, California, Round Table Pizza was born out of Larson’s vision to create a gathering place where people could share quality pizza made with gold-standard ingredients and time-honored recipes.
Round Table Pizza began its franchising journey in 1962, a few years after its establishment. The company has grown significantly since then, with its headquarters in Beverly Hills, California.
As part of the FAT Brands family, Round Table Pizza has maintained its commitment to quality and authenticity, earning the reputation of “Pizza Royalty” over the years.
Round Table Pizza celebrates community, family, and the joy of sharing. The brand is part of the FAT Brands family, which includes a variety of other well-known food and beverage outlets.
Round Table Pizza’s commitment to using superior ingredients, along with many of Larson’s original recipes, pays homage to its founder’s vision while also embracing a refreshed brand look to reflect the exceptional quality of its pizzas.

Initial Investment
How much does it cost to start a Round Table Pizza franchise? It costs on average between $347,000 – $1,092,000 to start a Round Table Pizza franchised restaurant.
This includes costs for construction, equipment, inventory, and initial operating expenses. The exact amount depends on various factors, including the type of restaurant you choose, the location, and whether the franchisee chooses to lease or purchase the property. Indeed, Round Table Pizza offers 2 types of franchises:
| Model | Initial Investment Range |
|---|---|
| DCU Model | $347,300 to $505,250 |
| Dine-In Model | $504,100 to $1,091,500 |
We are summarizing below the main costs associated with opening a Round Table Pizza franchised Dine-In Model restaurant. For more information on the costs required to start a Round Table Pizza franchise, refer to the Franchise Disclosure Document (Item 7).
| Type Of Expenditure | Amount (Dine-In Model) |
|---|---|
| Initial Franchise Fee | $25,000 |
| Travel And Living Expenses While Training | $1,500 – $3,500 |
| Real Estate And Improvements | $175,000 – $600,000 |
| Furniture, Fixture & Equipment | $210,000 – $295,000 |
| Point Of Sale Systems and Related Technology | $35,100 – $59,000 |
| Opening Inventory/ Smallwares | $12,000 – $15,000 |
| Interior Décor Package/ Exterior Signage | $15,000 – $35,000 |
| Uniforms | $1,000 – $2,000 |
| Insurance | $4,500 – $7,000 |
| Additional Funds – 3 Months | $25,000 – $50,000 |
| Total | $504,100 – $1,091,500 |
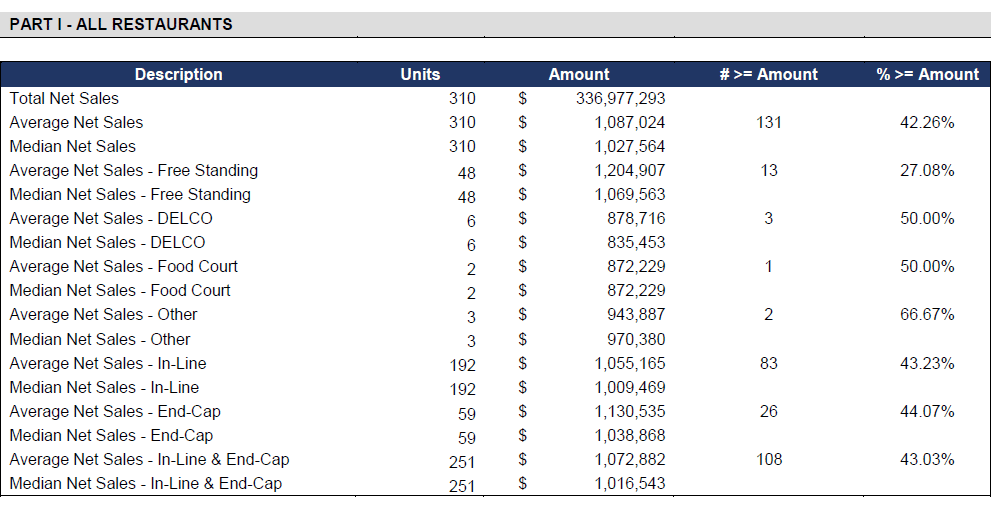
Average Revenue (AUV)
How much revenue can you make with a Round Table Pizza franchise? A Round Table Pizza franchised restaurant makes on average $1,028,000 in revenue (AUV) per year.
Here is the extract from the Franchise Disclosure Document:
This compares to $958,000 yearly revenue for similar pizza franchises. Below are 10 Round Table Pizza competitors as a comparison:

Download the Franchise Disclosure Document
Frequently Asked Questions
How many Round Table Pizza locations are there?
Round Table Pizza currently operates approximately 450 locations. Of these, 372 are franchised and 72 are company-owned across several U.S. states, mainly on the West Coast. They also have a small number of international outlet.
What is the total investment required to open a Round Table Pizza franchise?
The total investment required to open a Round Table Pizza franchise ranges from $347,000 to $1,092,000.
What are the ongoing fees for a Round Table Pizza franchise?
For a Round Table Pizza franchise, the ongoing royalty fee is typically 4% of gross sales, which is a standard fee in many franchising agreements to cover the continued use of the brand, support, and systems.
Additionally, franchisees are required to contribute an advertising fee of 4% of gross sales, which helps fund national and regional marketing campaigns to promote the brand and drive customer traffic to all locations.
What are the financial requirements to become a Round Table Pizza franchisee?
To become a Round Table Pizza franchisee, you must meet the minimum net worth requirement is typically $500,000, ensuring the franchisee has sufficient financial backing to operate the business.
Additionally, franchisees are required to have at least $200,000 in liquid assets, which provides the necessary cash reserves to cover initial expenses, working capital, and unforeseen costs during the setup and early operational phases of the business.
How much can a Round Table Pizza franchise owner expect to earn?
The average gross sales for a Round Table Pizza franchise are approximately $1.03 million per location. Assuming a 15% operating profit margin, $1.03 million yearly revenue can result in $154,200 EBITDA annually.
Who owns Round Table Pizza?
Round Table Pizza is owned by FAT Brands Inc., a global franchising company. FAT Brands acquired Round Table Pizza in 2021 as part of its acquisition of Global Franchise Group, which included other well-known brands. This acquisition expanded FAT Brands’ portfolio of restaurant concepts, which includes several fast-casual and quick-service chains.
Disclaimer
Disclaimer: This content has been made for informational and educational purposes only. We do not make any representation or warranties with respect to the accuracy, applicability, fitness, or completeness of the information presented in the article. You should not construe any such information or other material as legal, tax, investment, financial, or other professional advice. Nothing contained in this article constitutes a solicitation, recommendation, endorsement, advertisement, or offer to buy or sell any franchises, securities, or other financial instruments in this or in any other jurisdiction in which such solicitation or offer would be unlawful under the franchise and/or securities laws of such jurisdiction.
All content in this article is information of a general nature and does not address the detailed circumstances of any particular individual or entity. Nothing in the article constitutes professional and/or financial and/or legal advice, nor does any information in the article constitute a comprehensive or complete statement of the matters discussed or the law relating thereto. You alone assume the sole responsibility of evaluating the merits and risks associated with the use of any information or other content in this article before making any decisions based on such information or other content.