
Steak n’ Shake Franchise FDD, Profits & Costs (2025)

Steak ‘n Shake, founded in 1934 by Gus Belt in Normal, Illinois, is an iconic American diner known for its premium “steakburgers” and hand-dipped milkshakes. The name reflects its heritage: “steak” for the high-quality burgers made from real steak cuts, and “shake” for its classic milkshakes.
Now part of Biglari Holdings, Steak ‘n Shake has expanded over its 89-year history, maintaining a focus on delivering high-quality food at a great value. The franchise model offers both traditional franchising and a unique franchise partnership opportunity.
Steak ‘n Shake stands out by staying true to its roots while modernizing. It’s known for its 100% beef steakburgers and milkshakes made with real ice cream, setting it apart in the fast-food industry.

Initial Investment
How much does it cost to start a Steak ‘n Shake franchise? It costs on average between $316,000 – $2,695,000 to start a Steak ‘n Shake franchised restaurant.
This includes costs for construction, equipment, inventory, and initial operating expenses. The exact amount depends on various factors, including the type of restaurant you choose, the location, and whether the franchisee chooses to lease or purchase the property. Indeed, Steak ‘n Shake offers 3 types of franchises:
| Format | Initial Investment Range |
|---|---|
| Non-Traditional | $316,000 to $715,000 |
| In-line Quick Service Format | $454,000 to $1,364,000 |
| Freestanding Quick Service Format | $1,207,909 to $2,695,052 |
We are summarizing below the main costs associated with opening a Steak ‘n Shake Freestanding Quick Service Format franchise. For more information on the costs required to start a Steak ‘n Shake franchise, refer to the Franchise Disclosure Document (Item 7).
| Type of Expenditure | Amount |
|---|---|
| Franchise Fee | $25,000 |
| Construction Management / Fee | $0 to $35,000 |
| Site Improvements | $90,000 to $482,074 |
| Building or Leasehold Improvements | $612,359 to $1,342,341 |
| Furniture, Fixtures, Equipment, & Signage | $394,550 to $576,342 |
| Pre-Opening Expenses | $5,000 to $10,000 |
| Additional Funds for three (3) months | $15,000 to $20,000 |
| Inventory and Supplies for Opening | $10,000 to $15,000 |
| Training Expenses (travel, meals & lodging) | $16,000 to $55,000 |
| Architectural, Civil Engineering & Other Professional Fees & Permits | $35,000 to $88,050 |
| Impact and Tap Fees | $5,000 to $11,245 |
| Grand Opening Marketing Expenses | $0 to $25,000 |
| Extension Fee | $0 to $10,000 |
| TOTAL | $1,207,909 to $2,695,052 |
Average Revenue (AUV)
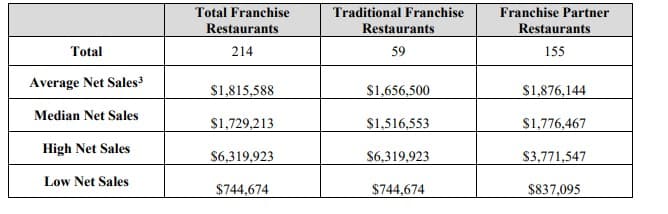
How much revenue can you make with a Steak ‘n Shake franchise? A Steak ‘n Shake franchised restaurant makes an average of $1,729,000 in revenue (AUV) per year.
Here is the extract from the Franchise Disclosure Document.
Steak 'n Shake Franchise Disclosure Document
Frequently Asked Questions
How many Steak ‘n Shake locations are there?
As of the latest data, Steak ‘n Shake operates 406 locations across the United States. This includes about 266 franchise-partner locations and 140 company-owned units.
What is the total investment required to open a Steak ‘n Shake franchise?
The total investment required to open a Steak ‘n Shake franchise ranges from $316,000 to $2,695,000.
What are the ongoing fees for a Steak ‘n Shake franchise?
Steak ‘n Shake franchisees are required to pay a 5.5% royalty fee on gross sales. Additionally, there is a required advertising and marketing service fee of 1% of gross sales.
What are the financial requirements to become a Steak ‘n Shake franchisee?
To qualify as a Steak ‘n Shake franchisee, you need a minimum net worth of $1,000,000 and at least $500,000 in liquid assets. These financial requirements ensure that franchisees have the resources necessary to operate their business successfully.
Who owns Steak ‘n Shake?
Steak ‘n Shake is owned by Biglari Holdings, a conglomerate led by CEO Sardar Biglari. Biglari Holdings acquired the company in 2008. Since then, it implemented various strategies to improve its operations, including converting more locations from company-owned to franchise-partner models.
Disclaimer
Disclaimer: This content has been made for informational and educational purposes only. SharpSheets is an independent educational resource and is not affiliated with, endorsed by, or representing any franchisor mentioned on this website. Where noted, figures are taken from the franchisor’s Franchise Disclosure Document (FDD). In some cases, we may provide independent calculations or estimates based on publicly available information. We do not make any representation or warranties with respect to the accuracy, applicability, fitness, or completeness of the information presented in the article. You should not construe any such information or other material as legal, tax, investment, financial, or other professional advice. Nothing contained in this article constitutes a solicitation, recommendation, endorsement, advertisement, or offer to buy or sell any franchises, securities, or other financial instruments in this or in any other jurisdiction in which such solicitation or offer would be unlawful under the franchise and/or securities laws of such jurisdiction.
All content in this article is information of a general nature and does not address the detailed circumstances of any particular individual or entity. Nothing in the article constitutes professional and/or financial and/or legal advice, nor does any information in the article constitute a comprehensive or complete statement of the matters discussed or the law relating thereto. You alone assume the sole responsibility of evaluating the merits and risks associated with the use of any information or other content in this article before making any decisions based on such information or other content.


