With over 6,300 franchise-owned restaurants in the US, Taco Bell is one of the most famous fast food restaurant brand in the US, and the world as a whole. That may sound like an easy business as franchisees benefit from an unparalleled brand recognition and customer loyalty.
With an investment cost of $462,413 on average and annual sales of $1,650,000, Taco Bell does seem like a great franchise opportunity. But is this a profitable business? What about the investment payback, as in the time it takes to recoup your investment?
Should you invest in a Taco Bell franchise?
In this article we’re looking at how much you can realistically make with a Taco Bell franchise, how much it costs and whether it’s a good investment as a franchisee. Let’s dive in!
Taco Bell franchise: key figures
Franchise fee | $22,500 |
Royalty fee | 10% |
Marketing fee | 4.25% |
Investment (mid-point) | $462,413 |
Average annual sales | $1,650,000 |
Investment to sales ratio | 3.6x (high) |
Investment payback* | 1.9 years (excellent) |
Minimum net worth | $1,500,000 |
Minimum liquid capital | $750,000 |
🔎 How does Taco Bell compare vs. other franchises? Check the ranking
Taco Bell franchise: an introduction
Taco Bell is an American fast food chain restaurant business. It is a subsidiary of Yum! Brands, Inc. Taco Bell sells Mexican-inspired foods such as nachos, quesadillas, burritos, tacos, etc.
Taco Bell was founded in 1962 by Glen Bell, but Pepsi purchased the brand in 1978 and made it a division of Tricon Global Restaurants, which was later renamed as Yum! Brands, Inc.
The first franchisee store opened in 1964, and by 1967, Taco Bell opened its 100th restaurant.
In 2018, Taco Bell had 7,072 restaurants operating globally (Asia, Europe, the UK, Middle East, North America, and Oceana), of which, 93% of the locations are franchise-owned stores.
Taco Bell franchise: pros and cons
If you intend to open a Taco Bell franchise, you must be aware of its advantages and disadvantages that include:
Pros
- Taco Bell is a well-known and respected brand, which can help to attract customers to the franchise
- Taco Bell provides support to its franchisees, including marketing and training assistance, which can help to improve the chances of success for the franchise
- Absentee ownership is allowed even though technically the franchisor requires hands-on operation from the franchisee. This means, a Taco Bell franchise can be your passive investment which you can engage in other activities
Cons
- As a franchisee, you will be required to follow the policies and procedures set by the parent company, which can limit your ability to make decisions about the operation of your franchise unlike some other franchise opportunities
- At 5.5%, the ongoing royalty fee is rather high. Additionally, there is an ongoing advertising fee of 4.25% which you must take into account
- The franchise fee is also on the higher end at $45,000
- Taco Bell requires each franchisee to have 25 employees, which means that the overhead cost is higher than normal
How much do you need to invest?
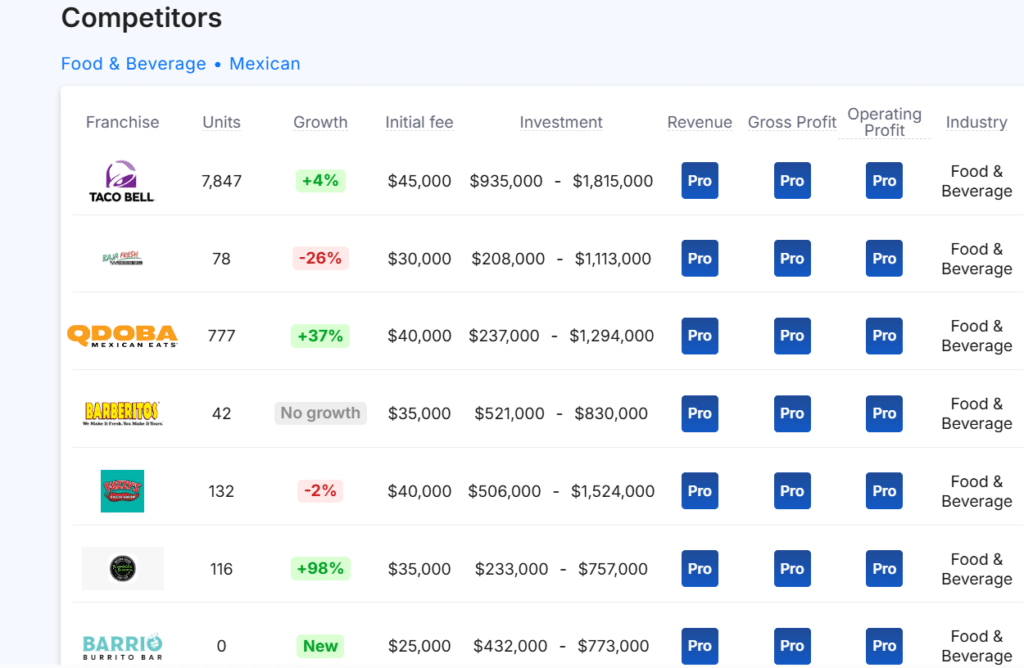
The average investment to open a Taco Bell restaurant is $462,413, including the initial franchise fee of $22,500.
Of course, this estimated average may defer depending on many factors (e.g. format of the restaurant, location, etc.). For example, you will invest less for a Custom Facades than the Power Pumpers & In-Lines restaurant format.
Format | Lowest | Highest | Average |
Custom Facades | $227,500 | $590,100 | $408,800 |
Power Pumpers & In-Lines | $320,950 | $711,100 | $516,025 |
Total | $462,413 |
The investment amount does not only includes the initial franchise fee but also the other expenses a fast-food restaurant would need at the starting.
For example, design services fee, first month’s rent, architectural fees, equipment, decor, buildout and construction, business license, permits, and additional funds for 3 months are included in the initial investment amount.
Here’s a summary of the different costs you should pay for:
Type of Cost | Investment amount |
Initial Franchise Fee | $22,500 |
Opening costs | $192,000 – $660,100 |
Operating expenses | $13,000 – $28,500 |
Total | $227,500 – $711,100 |
What is the turnover of a Taco Bell franchise?
As per public records, a Taco Bell franchise makes $1,647,000 in sales per year on average. That’s an impressive number in regards to similar competitors in the quick-service restaurant industry.
How profitable is a Taco Bell franchise?
Taco Bell’s Franchise Disclosure Document doesn’t give much details on COGS and labor costs unfortunately. Yet it does give some guidance and some other details, especially rent costs: they’re only $49,000 per year on average, quite low vs. similar franchises.
Of course, this relatively low rent is in contrast with high royalty and marketing fees (14.25% total) which is much higher vs. other quick-service restaurant franchises (~8-10% on average).
Therefore, as per our analysis, Taco Bell franchises have an adjusted EBITDA of 29% on average. We obtained this number by using Taco Bell’s average turnover, costs as well as industry average for COGS and labor costs. See our calculation below:
Profit-and-loss | Amount ($) | As % of sales |
---|---|---|
Sales | $1,650,000 | 100% |
COGS | $(412,500) | 25%* |
Labor | $(478,500) | 29%* |
Rent | $(39,600) | |
Royalty + marketing fees | $(235,125) | 14.25% |
Operating profit | $484,275 | ~29% |
Is a Taco Bell franchise a good investment?
All in all, despite high royalty and marketing fees, Taco Bell are very profitable franchises (~29% adjusted EBITDA margin). But what about net profit margin?
Like most franchises, Taco Bell doesn’t give any details on the average net profit margin for its franchises. So in order for us to assess whether starting a Taco Bell franchise is a good investment, we need to estimate net profit and then calculate the investment payback.
Using Taco Bell’s latest FDD numbers, the investment payback is actually very good: it takes franchisees and their investors on average 1.9 years to recoup the initial investment of $462,413.
In that regard, if your franchise application is successful and accepted, you should definitely go ahead: Taco Bell is undeniably a good investment from a financial standpoint.
How does Taco Bell compare vs. other franchises?
Franchise | Investment ($) | Sales ($) | S/I Ratio | Payback (years) | Min. net worth ($) | Min. liquid capital ($) | ||
---|---|---|---|---|---|---|---|---|
Chick-Fil-A | https://sharpsheets.io/blog/chick-fil-a-franchise-costs-profits/ | Chicken | 1,363,510 | 4,227,417 | 3.1 | 2.2 | - | - |
Dunkin' Donuts | https://sharpsheets.io/blog/dunkin-donuts-franchise-costs-profits/ | Donuts | 779,000 | 1,056,521 | 1.4 | 4.9 | 500,000 | 250,000 |
Domino's | https://sharpsheets.io/blog/dominos-franchise-profits-costs/ | Pizza | 398,725 | 1,286,428 | 3.2 | 3.9 | 250,000 | 75,000 |
Krispy Kreme | https://sharpsheets.io/blog/krispy-kreme-franchise-costs-profits/ | Donuts | 824,000 | 3,400,000 | 4.1 | 1.6 | 2,000,000 | 300,000 |
Little Caesars | https://sharpsheets.io/blog/little-caesars-franchise-costs-profits/ | Pizza | 1,022,850 | 798,113 | 0.8 | 8.5 | 350,000 | 150,000 |
Wingstop | https://sharpsheets.io/blog/wingstop-franchise-costs-profits/ | Chicken | 631,695 | 1,460,459 | 2.3 | 2.9 | 1,200,000 | 600,000 |
Steak 'n Shake | https://sharpsheets.io/blog/steak-n-shake-franchise-costs-profits/ | Burger, Milshakes | 815,626 | 1,346,332 | 1.7 | 4.0 | 1,500,000 | 500,000 |
Crumbl Cookies | https://sharpsheets.io/blog/crumbl-cookie-franchise-cost-profits/ | Sweets | 507,224 | 1,582,090 | 3.1 | 2.1 | 300,000 | 150,000 |
Taco Bell | https://sharpsheets.io/blog/taco-bell-franchise-costs-profits/ | Mexican | 462,413 | 1,650,000 | 3.6 | 1.9 | 1,500,000 | 750,000 |
Popeyes | https://sharpsheets.io/blog/popeyes-franchise-costs-profits/ | Chicken | 1,095,783 | 1,444,617 | 1.3 | 5.1 | 1,000,000 | 500,000 |
Smoothie King | https://sharpsheets.io/blog/smoothie-king-franchise-costs-profits/ | Smoothie | 688,108 | 573,269 | 0.8 | 8.0 | 300,000 | 100,000 |
Jersey Mike's | https://sharpsheets.io/blog/jersey-mikes-franchise-costs-profits/ | Sandwich | 574,323 | 1,220,586 | 2.1 | 4.7 | 300,000 | 100,000 |
Nothing Bundt Cakes | https://sharpsheets.io/blog/nothing-bundt-cakes-franchise-costs-profits/ | Sweets | 538,650 | 1,307,280 | 2.4 | 2.7 | 600,000 | 150,000 |
Jimmy John's | https://sharpsheets.io/blog/jimmy-johns-franchise-costs-profits/ | Sandwich | 513,650 | 874,845 | 1.7 | 3.9 | 300,000 | 80,000 |
Texas Roadhouse | https://sharpsheets.io/blog/texas-roadhouse-franchise-costs-profits/ | Steakhouse | 4,209,500 | 2,955,534 | 0.7 | 9.5 | n.a. | 200,000 |
Kung Fu Tea | https://sharpsheets.io/blog/kung-fu-tea-franchise-costs-profits/ | Bubble tea | 250,125 | 353,237 | 1.4 | 4.7 | n.a. | 25,000 |
Wendy’s | https://sharpsheets.io/blog/wendys-franchise-cost-profits/ | Burger | 1,374,833 | 1,791,231 | 1.3 | 5.1 | 1,000,000 | 500,000 |
Burger King | https://sharpsheets.io/blog/burger-king-franchise-costs-profits/ | Burger | 1,242,950 | 1,215,970 | 1.0 | 6.8 | 1,500,000 | 500,000 |
Sonic Drive-In | https://sharpsheets.io/blog/sonic-drive-in-franchise-costs-profits/ | Burger | 1,467,083 | 1,617,000 | 1.1 | 6.0 | 1,000,000 | 500,000 |
Panera Bread | https://sharpsheets.io/blog/panera-bread-franchise-costs-profits/ | Sandwich | 2,290,500 | 2,599,432 | 1.1 | 5.9 | 7,500,000 | 3,000,000 |
Pizza Hut | https://sharpsheets.io/blog/pizza-hut-franchise-costs-profits/ | Pizza | 935,575 | 906,911 | 1.0 | 6.9 | 700,000 | 350,000 |
KFC | https://sharpsheets.io/blog/kfc-franchise-costs-profits/ | Chicken | 1,802,050 | 1,567,474 | 0.9 | 7.7 | 1,500,000 | 750,000 |
Arby’s | https://sharpsheets.io/blog/arbys-franchise-costs-profits/ | Sandwich | 1,184,975 | 1,126,263 | 1.0 | 7.0 | 1,000,000 | 500,000 |
Dairy Queen | https://sharpsheets.io/blog/dairy-queen-franchise-costs-profits/ | Ice Cream | 1,404,220 | 1,143,180 | 0.8 | 8.2 | 750,000 | 400,000 |
Jack in the Box | https://sharpsheets.io/blog/jack-in-the-box-franchise-costs-profits/ | Burger | 2,195,800 | 1,755,503 | 0.8 | 12.5 | 1,000,000 | 250,000 |
Papa John’s | https://sharpsheets.io/blog/papa-johns-franchise-costs-profits/ | Pizza | 353,695 | 1,101,127 | 3.1 | 2.1 | 750,000 | 250,000 |
Zaxby’s | https://sharpsheets.io/blog/zaxbys-franchise-costs-profits/ | Chicken | 534,750 | 2,229,187 | 4.2 | 2.4 | 1,000,000 | 500,000 |
Hardee’s | https://sharpsheets.io/blog/hardees-franchise-costs-profits/ | Burger | 1,759,000 | 1,147,975 | 0.7 | 10.2 | 1,000,000 | 300,000 |
Culver’s | https://sharpsheets.io/blog/culvers-franchise-costs-profits/ | Burger | 4,044,500 | 3,051,762 | 0.8 | 8.8 | 2,000,000 | 350,000 |
Five Guys | https://sharpsheets.io/blog/five-guys-franchise-costs-profits/ | Burger | 511,225 | 1,203,366 | 2.4 | 2.8 | 500,000 | 250,000 |
Carl’s Jr. | https://sharpsheets.io/blog/carls-jr-franchise-costs-profits/ | Burger | 1,860,335 | 1,419,516 | 0.8 | 8.7 | 1,000,000 | 500,000 |
Baskin-Robbins | https://sharpsheets.io/blog/baskin-robbins-franchise-costs-profits/ | Ice Cream | 465,100 | 316,815 | 0.7 | 9.8 | 250,000 | 125,000 |
IHOP | https://sharpsheets.io/blog/ihop-franchise-costs-profits/ | Pancakes | 2,058,302 | 1,553,311 | 0.8 | 8.8 | 1,500,000 | 500,000 |
Applebee’s | https://sharpsheets.io/blog/applebees-franchise-costs-profits/ | Casual American | 5,137,966 | 2,356,965 | 0.5 | 14.5 | 1,000,000 | 500,000 |
Denny's | https://sharpsheets.io/blog/dennys-franchise-costs-profits/ | Casual American | 3,785,459 | 1,639,549 | 0.4 | 15.4 | 1,000,000 | 500,000 |
Papa Murphy's | https://sharpsheets.io/blog/papa-murphys-franchise-costs-profits/ | Pizza | 433,174 | 580,441 | 1.3 | 5.0 | 275,000 | 125,000 |
Auntie Anne's | https://sharpsheets.io/blog/auntie-annes-franchise-costs-profits/ | Pretzels | 229,692 | 343,135 | 1.5 | 5.6 | 300,000 | 100,000 |
Firehouse Subs | https://sharpsheets.io/blog/firehouse-subs-franchise-costs-profits/ | Sandwich | 613,186 | 888,356 | 1.4 | 4.6 | 350,000 | 100,000 |
Tropical Smoothie Cafe | https://sharpsheets.io/blog/tropical-smoothie-cafe-franchise-costs-profits/ | Smoothie | 430,500 | 961,969 | 2.2 | 3.0 | 350,000 | 125,000 |
Marco’s Pizza | https://sharpsheets.io/blog/marcos-pizza-franchises-costs-profits/ | Pizza | 437,625 | 895,523 | 2.0 | 3.3 | 400,000 | 100,000 |
Cinnabon | https://sharpsheets.io/blog/cinnabon-franchises-costs-profits/ | Sweets | 276,062 | 394,897 | 1.4 | 5.8 | 300,000 | 120,000 |
Cold Stone Creamery | https://sharpsheets.io/blog/cold-stone-creamery-franchise-costs-profits/ | Ice Cream | 310,956 | 417,588 | 1.3 | 5.0 | 250,000 | 100,000 |
Jamba | https://sharpsheets.io/blog/jamba-franchise-costs-profits/ | Smoothie | 414,562 | 597,028 | 1.4 | 7.7 | 300,000 | 100,000 |
Church’s Chicken | https://sharpsheets.io/blog/churchs-texas-chicken-fees-sales-costs/ | Chicken | 1,195,147 | 1,395,088 | 1.2 | 5.7 | 1,000,000 | 300,000 |
Moe’s Southwest Grill | https://sharpsheets.io/blog/moes-southwest-grill-franchises-costs-profits/ | Mexican | 792,370 | 1,013,361 | 1.3 | 5.2 | 1,000,000 | 100,000 |
Tim Hortons | https://sharpsheets.io/blog/tim-hortons-franchises-costs-profits/ | Coffee | 1,242,750 | 1,188,240 | 1.0 | 7.0 | 500,000 | 100,000 |
Checkers & Rally's | https://sharpsheets.io/blog/checkers-franchises-profits-sales-costs/ | Burger | 837,847 | 1,039,773 | 1.2 | 5.4 | 750,000 | 250,000 |
Charleys Philly Steaks | https://sharpsheets.io/blog/charleys-philly-steaks-costs-profits/ | Sandwich | 509,806 | 786,233 | 1.5 | 4.3 | 500,000 | 100,000 |
Buffalo Wild Wings | https://sharpsheets.io/blog/buffalo-wild-wings-costs-profits/ | Chicken | 3,546,900 | 2,534,148 | 0.7 | 9.3 | 1,500,000 | 750,000 |
Rita's Ice | https://sharpsheets.io/blog/ritas-ice-franchise-costs-profits/ | Ice Cream | 215,839 | 248,340 | 1.2 | 5.8 | 300,000 | 100,000 |
A&W Restaurants | https://sharpsheets.io/blog/aw-restaurants-franchises-costs-profits/ | Burger | 786,750 | 851,212 | 1.1 | 6.2 | 350,000 | 150,000 |
Hungry Howie’s Pizza | https://sharpsheets.io/blog/hungry-howies-pizza-franchise-costs-profits/ | Pizza | 419,682 | 806,899 | 1.9 | 3.5 | 750,000 | 200,000 |
Bojangles | https://sharpsheets.io/blog/bojangles-franchise-costs-profits/ | Chicken | 1,658,000 | 1,801,057 | 1.1 | 6.1 | 1,000,000 | 500,000 |
McAlister’s Deli | https://sharpsheets.io/blog/mcalister-deli-franchise-costs-profits/ | Sandwich | 1,424,963 | 1,865,861 | 1.3 | 5.1 | 1,000,000 | 500,000 |
Round Table Pizza | https://sharpsheets.io/blog/round-table-pizza-franchise-costs-profits/ | Pizza | 783,250 | 1,037,816 | 1.3 | 5.0 | 500,000 | 200,000 |
Qdoba Mexican Eats | https://sharpsheets.io/blog/qdoba-mexican-eats-franchise-costs-profits/ | Mexican | 659,250 | 972,962 | 1.5 | 4.5 | ||
Freddy’s | https://sharpsheets.io/blog/freddys-franchise-costs-profits/ | Burger | 1,453,040 | 1,792,929 | 1.2 | 5.4 | 1,000,000 | 400,000 |
Taco John’s | https://sharpsheets.io/blog/taco-johns-franchise-costs-profits/ | Mexican | 1,119,000 | 1,124,980 | 1.0 | 6.6 | 1,000,000 | 400,000 |
Scooter’s Coffee | https://sharpsheets.io/blog/scooters-coffee-franchise-costs-profits/ | Coffee | 1,143,250 | 797,101 | 0.7 | 9.6 | 500,000 | 200,000 |
Einstein Bros. Bagels | https://sharpsheets.io/blog/einstein-bros-bagels-franchise-costs-profits/ | Sandwich | 750,075 | 885,011 | 1.2 | 5.7 | 1,000,000 | 536,500 |
Great American Cookies | https://sharpsheets.io/blog/great-american-cookies-franchise-costs-profits/ | Sweets | 385,275 | 452,771 | 1.2 | 5.7 | 250,000 | 100,000 |
Wienerschnitzel | https://sharpsheets.io/blog/wienerschnitzel-franchise-costs-profits/ | Hot dogs | 873,300 | 880,980 | 1.0 | 6.6 | 600,000 | 250,000 |
Blaze Pizza | https://sharpsheets.io/blog/blaze-pizza-franchise-costs-profits/ | Pizza | 865,450 | 1,096,432 | 1.3 | 7.9 | 500,000 | 300,000 |
Wetzel's Pretzels | https://sharpsheets.io/blog/wetzels-pretzels-franchise-costs-profits/ | Pretzels | 377,571 | 748,857 | 2.0 | 3.4 | 300,000 | 50,000 |
Pizza Ranch | https://sharpsheets.io/blog/pizza-ranch-franchise-costs-profits/ | Pizza | 3,268,300 | 1,174,088 | 0.4 | 18.6 | 1,000,000 | 297,000 |
Del Taco | https://sharpsheets.io/blog/del-taco-franchise-costs-profits/ | Mexican | 1,406,850 | 1,345,341 | 1.0 | 7.0 | 2,000,000 | 500,000 |
Schlotzsky’s | https://sharpsheets.io/blog/schlotzskys-franchises-costs-profits/ | Healthy, Salads | 1,102,933 | 1,053,333 | 0.3 | 22.2 | 1,000,000 | 300,000 |
Captain D’s | https://sharpsheets.io/blog/captain-ds-franchise-profits-costs/ | Seafood | 982,778 | 1,067,816 | 0.4 | 19.0 | 1,000,000 | 350,000 |
Biggby Coffee | https://sharpsheets.io/blog/biggby-coffee-franchise-profits-costs/ | Coffee | 310,575 | 648,352 | 0.3 | 20.0 | 300,000 | 100,000 |
Which Wich | https://sharpsheets.io/blog/which-wich-franchises-profits-costs/ | Sandwich | 330,375 | 281,886 | 0.3 | 22.2 | 500,000 | 150,000 |
Marble Slab Creamery | https://sharpsheets.io/blog/marble-slab-franchises-costs-profits/ | Ice Cream | 407,360 | 251,052 | 0.4 | 16.7 | 250,000 | 100,000 |
Mountain Mike's Pizza | https://sharpsheets.io/blog/mountain-mikes-franchise-profits-costs/ | Pizza | 410,900 | 865,713 | 0.3 | 20.0 | 300,000 | 100,000 |
Huddle House | https://sharpsheets.io/blog/huddle-house-franchise-cost-profits/ | Diner | 988,743 | 712,428 | 0.5 | 13.3 | 600,000 | 300,000 |
L&L Hawaiian Barbecue | https://sharpsheets.io/blog/ll-hawaiian-barbecue-franchises-costs-profits/ | BBQ | 334,350 | 612,921 | 0.3 | 33.3 | 500,000 | 150,000 |
Chicken Salad Chick | https://sharpsheets.io/blog/chicken-salad-chick-franchises-costs-profits/ | Healthy, Salads | 651,000 | 1,202,020 | 0.3 | 20.0 | 750,000 | 250,000 |
Golden Chick | https://sharpsheets.io/blog/golden-chick-franchises-costs-profits/ | Chicken | 362,975 | 917,609 | 2.5 | 2.6 | 2,000,000 | 425,000 |
Perkins | https://sharpsheets.io/blog/perkins-franchise-costs-profits/ | Diner | 1,922,728 | 1,729,246 | 0.9 | 7.4 | 1,500,000 | 500,000 |
Waba Grill | https://sharpsheets.io/blog/waba-grill-franchises-costs-profits/ | Teryaki | 454,000 | 466,536 | 1.0 | 6.5 | 1,000,000 | 250,000 |
Bruster’s Ice Cream | https://sharpsheets.io/blog/brusters-franchises-profits-costs/ | Ice Cream | 663,925 | 466,696 | 0.7 | 9.5 | 375,000 | 150,000 |