
Teriyaki Madness Franchise FDD, Profits & Costs

Teriyaki Madness, often abbreviated as TMAD, is a rapidly expanding fast-casual restaurant chain that specializes in Seattle-style teriyaki bowls.
Founded in 2003 and headquartered in Denver, Colorado, TMAD began franchising in 2005.
The franchise offers a menu centered around a variety of hearty, flavorful, and customizable teriyaki dishes, using high-quality ingredients like fresh, never frozen, marinated and grilled meats, and house-made sauces.
What sets Teriyaki Madness apart in the competitive fast-casual segment is its commitment to providing healthy food options that do not compromise on taste.

Initial Investment
How much does it cost to start a Teriyaki Madness franchise? It costs on average between $376,000 – $976,000 to start a Teriyaki Madness franchised restaurant.
This includes costs for construction, equipment, inventory, and initial operating expenses. The exact amount depends on various factors, including the type of restaurant you choose, the location, and whether the franchisee chooses to lease or purchase the property.
| Type of Expenditure | Amount (Low–High) |
|---|---|
| Initial Franchise Fee | $45,000 – $45,000 |
| Shop Opening Assistance Fee | $27,500 – $27,500 |
| Site Survey | $2,000 – $6,500 |
| Rent, Security Deposit, Utility Deposit | $7,000 – $21,000 |
| Permit Expeditor | $0 – $3,500 |
| Leasehold Improvements | $134,000 – $520,000 |
| Furniture, Fixtures and Equipment | $76,000 – $174,000 |
| Architect | $16,500 – $30,500 |
| Initial Inventory and Supplies | $17,000 – $18,000 |
| Insurance | $1,500 – $5,000 |
| Business Licenses and Permits | $500 – $9,860 |
| Professional Fees | $2,500 – $4,000 |
| Exterior Signage | $5,500 – $27,000 |
| Interior Branding/Graphics | $6,800 – $10,000 |
| Security and Music System | $1,600 – $2,000 |
| Point of Sale System | $10,000 – $15,000 |
| Office Equipment and Supplies | $1,000 – $4,000 |
| Grand Opening Promotion | $10,000 – $10,000 |
| Uniforms | $600 – $1,000 |
| Initial and Hands-On Training Expenses | $1,200 – $4,500 |
| Extension Fee | $0 – $7,500 |
| Additional Funds – 3 Months | $10,000 – $30,000 |
| Total Estimated Initial Investment | $376,200 – $975,860 |
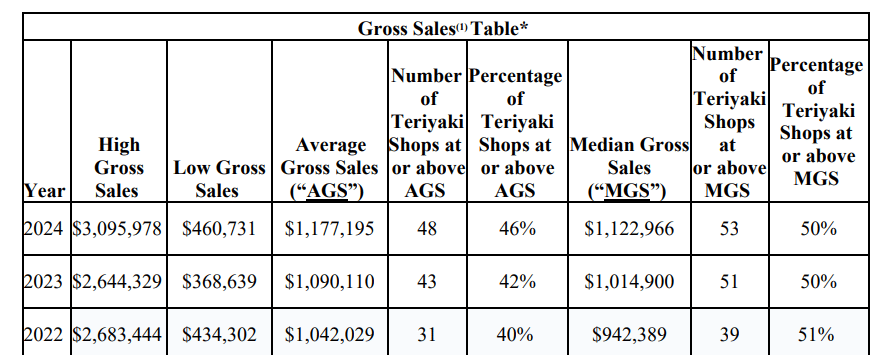
Average Revenue (AUV)
How much revenue can you make with a Teriyaki Madness franchise? A Teriyaki Madness franchised restaurant makes on average 1,123,000 in revenue (AUV) per year.
Here is the extract from the Franchise Disclosure Document:
Teriyaki Madness Franchise Disclosure Document
Frequently Asked Questions
What funding options are available for a Teriyaki Madness franchise?
Most franchise buyers in Teriyaki Madnesss investment range finance their unit through an SBA 7(a) loan, with some multi-unit operators using SBA 504 loans. Buyers with rollable retirement funds sometimes use a ROBS structure. See SharpSheets financial model hub for guidance.
How long does it take to pay back a Teriyaki Madness franchise investment?
Payback periods typically run 3-7 years depending on investment level, location performance, and financing structure. Actual payback varies significantly by unit performance and debt service obligations.
Who owns Teriyaki Madness?
Teriyaki Madness is owned by Michael Haith, who serves as the company’s Chief Executive Officer. Haith acquired the brand in 2016 and has since overseen its expansion and strategic direction.
SharpSheets Editorial Team | sharpsheets.io | Last Updated: July 2026
Disclaimer
Disclaimer: This content has been made for informational and educational purposes only. SharpSheets is an independent educational resource and is not affiliated with, endorsed by, or representing any franchisor mentioned on this website. Where noted, figures are taken from the franchisor’s Franchise Disclosure Document (FDD). In some cases, we may provide independent calculations or estimates based on publicly available information. We do not make any representation or warranties with respect to the accuracy, applicability, fitness, or completeness of the information presented in the article. You should not construe any such information or other material as legal, tax, investment, financial, or other professional advice. Nothing contained in this article constitutes a solicitation, recommendation, endorsement, advertisement, or offer to buy or sell any franchises, securities, or other financial instruments in this or in any other jurisdiction in which such solicitation or offer would be unlawful under the franchise and/or securities laws of such jurisdiction.
All content in this article is information of a general nature and does not address the detailed circumstances of any particular individual or entity. Nothing in the article constitutes professional and/or financial and/or legal advice, nor does any information in the article constitute a comprehensive or complete statement of the matters discussed or the law relating thereto. You alone assume the sole responsibility of evaluating the merits and risks associated with the use of any information or other content in this article before making any decisions based on such information or other content.
Research Teriyaki Madness Franchises franchise data: For the full FDD cost breakdown, investment tables, and Item 19 disclosures, visit FranchisePayback.com → Teriyaki Madness Franchises FDD Review.


