
Baskin-Robbins Franchise FDD, Profits & Costs (2025)
Baskin-Robbins, a leader in the ice cream industry, was founded in 1945. Ice cream lovers Irv Robbins and Burt Baskin, based in Glendale, California, created the brand after serving in the military.
Their partnership led to the creation of a family-friendly ice cream chain. The Baskin-Robbins name came from a coin toss, favoring Burt Baskin. The company, now headquartered in Canton, MA, began franchising on May 20, 1948, marking a key moment in its growth.
Baskin-Robbins is known for innovation, offering over 1,000 flavors to cater to diverse tastes and dietary needs. Its adaptability earned it recognition as the #1 ice cream franchise by Entrepreneur Magazine in 2021.

Initial Investment
How much does it cost to start a Baskin-Robbins franchise? It costs on average between $307,000 – $623,000 to start a Baskin-Robbins franchised restaurant.
This includes costs for construction, equipment, inventory, and initial operating expenses. The exact amount depends on various factors, including the type of restaurant you choose, the location, and whether the franchisee chooses to lease or purchase the property.
| Type of Expenditure | Amount |
|---|---|
| Initial Franchise Fee | $25,000 |
| Real Estate Development | $123,000 to $267,000 |
| Equipment, Fixtures and Signs | $115,000 to $185,000 |
| Restaurant Technology System | $15,000 to $29,500 |
| Licenses, Permits, Fees and Deposits | $7,000 to $20,000 |
| Opening Inventory | $5,000 to $8,000 |
| Miscellaneous Opening Costs | $9,500 to $28,000 |
| Uniforms | $400 to $800 |
| Insurance | $3,500 to $8,300 |
| Travel and Living Expenses While Training | $1,000 to $15,000 |
| Marketing Start-Up Fee | $3,000 to $6,000 |
| Additional Funds for First 3 Months | $0 to $30,000 |
| Total | $307,400 to $622,600 |
Average Revenue (AUV)
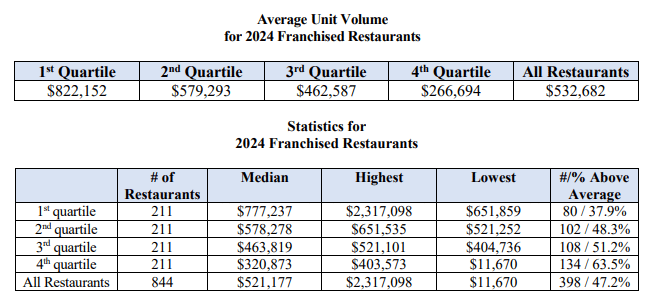
How much revenue can you make with a Baskin-Robbins franchise? A Baskin-Robbins franchised restaurant makes on average $521,000 in revenue (AUV) per year.
Here is the extract from the Franchise Disclosure Document:
Baskin-Robbins Franchise Disclosure Document
Frequently Asked Questions
How many Baskin-Robbins locations are there?
As of the latest data, the brand operates a total of 976 units, all of which are franchised. There are no company-owned locations, making Baskin-Robbins a fully franchised system.
What is the total investment required to open a Baskin-Robbins franchise?
The total investment required to open a Baskin-Robbins franchise ranges from $307,000 to $623,000.
What are the ongoing fees for a Baskin-Robbins franchise?
For a Baskin-Robbins franchise, ongoing fees include a royalty fee of 5.9% of gross sales. This fee ensures franchisees receive continued support from the franchisor, including operational guidance and brand consistency.
Additionally, franchisees are required to pay a marketing or advertising fee of 5% of gross sales. This fee supports regional and national advertising campaigns designed to boost brand awareness and drive traffic to all Baskin-Robbins locations.
What are the financial requirements to become a Baskin-Robbins franchisee?
To become a Baskin-Robbins franchisee, you must meet a minimum net worth of $250,000, ensuring that potential franchisees have sufficient overall financial backing.
Additionally, candidates must have at least $125,000 in liquid assets, which reflects the need for readily available funds to cover the initial investment, operational costs, and any unforeseen expenses.
These financial prerequisites help ensure that franchisees can maintain the financial stability necessary to operate a successful Baskin-Robbins franchise.
Who owns Baskin-Robbins?
Baskin-Robbins is owned by Inspire Brands, a major multi-brand restaurant company. Inspire Brands acquired Baskin-Robbins, along with Dunkin’ Donuts, in December 2020.
The acquisition was part of a deal valued at approximately $11.3 billion. Inspire Brands owns several other well-known restaurant chains, including Arby’s, Buffalo Wild Wings, Sonic Drive-In, and Jimmy John’s, making it one of the largest restaurant companies in the world.
Disclaimer
Disclaimer: This content has been made for informational and educational purposes only. SharpSheets is an independent educational resource and is not affiliated with, endorsed by, or representing any franchisor mentioned on this website. Where noted, figures are taken from the franchisor’s Franchise Disclosure Document (FDD). In some cases, we may provide independent calculations or estimates based on publicly available information. We do not make any representation or warranties with respect to the accuracy, applicability, fitness, or completeness of the information presented in the article. You should not construe any such information or other material as legal, tax, investment, financial, or other professional advice. Nothing contained in this article constitutes a solicitation, recommendation, endorsement, advertisement, or offer to buy or sell any franchises, securities, or other financial instruments in this or in any other jurisdiction in which such solicitation or offer would be unlawful under the franchise and/or securities laws of such jurisdiction.
All content in this article is information of a general nature and does not address the detailed circumstances of any particular individual or entity. Nothing in the article constitutes professional and/or financial and/or legal advice, nor does any information in the article constitute a comprehensive or complete statement of the matters discussed or the law relating thereto. You alone assume the sole responsibility of evaluating the merits and risks associated with the use of any information or other content in this article before making any decisions based on such information or other content.


