
12 Enterprise SaaS Financial Metrics (+ Benchmark)

If you’re running a software business, you might wonder how your company fares vs. competitors. Luckily, there are a few financial metrics Enterprise SaaS companies should track to compare against benchmarks to understand whether they are under or over performing.
From ARR per Customer, Net Dollar Retention, CAC Payback, Rule of 40, etc. here are the 12 metrics you should track for your business. For each of these metrics, we’re also giving you their benchmark using 120 Nasdaq-listed software companies.
Note that we calculated all the financial metrics we present below. As such, all numbers come from the relevant companies' latest financial reports (either 10K or 10Q as of December 2021 or March 2022).
Let’s dive in!
1. Annualized Recurring Revenue (ARR)
Annualized Recurring Revenue (ARR) is one of the most important metrics for Enterprise SaaS.
ARR can be calculated in a number of ways. Most often, we use the latest quarter’s recurring revenue which we multiply by 4 to obtain annualized revenue.
ARR = Latest quarter recurring revenue x 4
Most software companies also calculate ARR using the latest MRR. The problem with using MRR is that ARR can vary significantly from one to another (especially if you win or loses a big account).
Average Revenue per table = Latest MRR x 12
Why do we use ARR?
When we look at Enterprise SaaS companies, we often use ARR as a revenue metric instead of revenue itself. Why? We use it to account for the predictability of revenue.
Indeed, unlike B2C subscription, Enterprise SaaS businesses often have 1 to 3 year contracts with their customers. So instead of looking at the last 12 months revenue (which we usually do for any other business), we look at ARR for Enterprise SaaS instead.
For example, let’s consider the Enterprise SaaS business below:
| Q1 | Q2 | Q3 | Q4 | LTM* | ARR | |
|---|---|---|---|---|---|---|
| Revenue | $100 | $105 | $104 | $112 | $425 | $448 |
If we were to use LTM, we wouldn’t be accounting for the recent new (long-term) contracts that the business just won and pushed quarterly revenue to $112 in the latest quarter. That’s why we can safely assume the business now generates $448 per year (and not just $425).
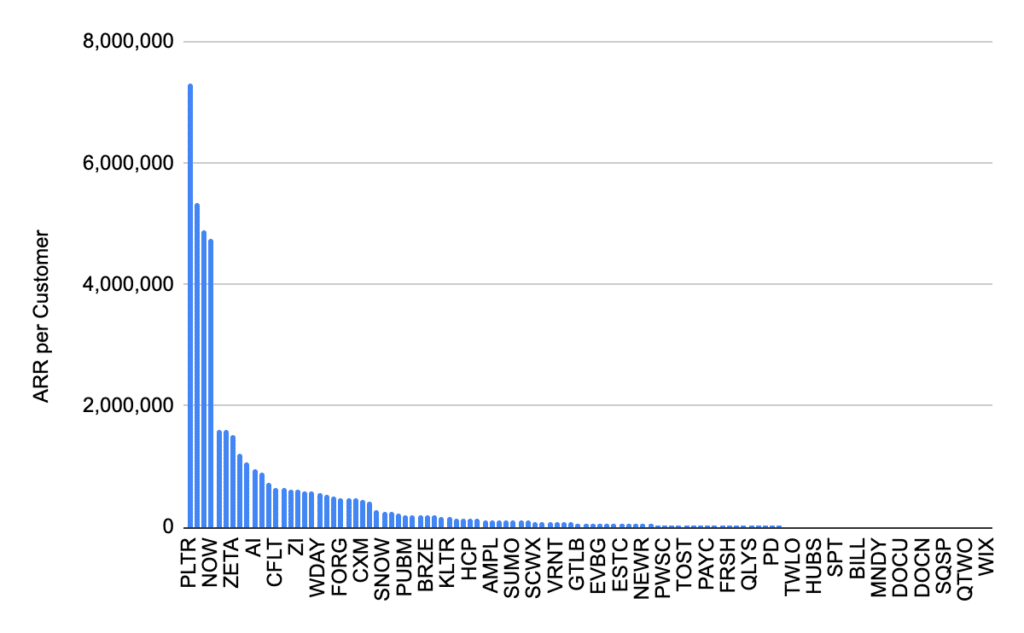
Enterprise SaaS metrics benchmark: ARR
ARR vary significantly from one company to another. We have included below the list of 120 Nasdaq-listed software & cloud companies ranked by ARR.
Of course, this list may seem irrelevant as we are using publicly listed companies with thousands of customers. We’ll now look into ratios that you can actually use, starting with ARR per customer.

2. ARR per Account
This Enterprise SaaS metric is similar to the Average Revenue per Customer (ARPC), or even Average Revenue per User (ARPU) for B2C subscription companies.
ARR per Account = ARR / # Active accounts
Why do we use ARR per Customer?
ARR per Customer gives a pretty good idea of the service you offer, and the type of customers you have. For example, a Dev Ops software company usually have higher ARR vs. marketing and HR Enterprise SaaS companies.
This financial metric is also very useful when we look at revenue diversification. Unlike B2C SaaS, even the biggest software firms sometimes have a high percentage of their revenue coming from a handful of customers.
For example, ideally you wouldn’t an account that represents more than 5% of your revenue.
Enterprise SaaS benchmark: ARR by Customer
As you can see, there is no such thing as an average ARR by Customer, even for Enterprise SaaS. For example, here’s the highest and lowest ARR by Customer metric of our 120+ companies benchmark:
- Highest: Palantir ($7,300,000)
- Lowest: Wix ($6, including all free user accounts…)
3. Net Dollar Retention
Net Dollar Retention is a common metric for Enterprise SaaS companies. It represents the year-over-year performance of the average revenue per customer. In other words, it compares the amount of revenue last-year existing customers are bringing this year vs. last year.
Net Dollar Retention = ARR per Account (year 2) / ARR per Account (year 1)
Note that we only take into consideration accounts that were customers in both years. For example, let’s assume a software company with:
- Last year: 100 accounts, $1,000 ARR ($10 ARR per account)
- This year: 10 churned accounts, $1,050 ARR ($11.7 ARR per account)
Then, net dollar retention is $11.7 / $10 = +117%.
Why do we use Net Dollar Retention?
The metric is quite useful to assess a company’s ability to upsell to its existing customers. When we assess Net dollar retention, anything above:
- 100% is good
- 110% is great
- 120% is excellent
In the example above, even though the company lost 10 of last year’s accounts, their average ARR increased by +5%. In other words, the company was able to upsell to the 90 remaining accounts and increase their average ARR by 17%.
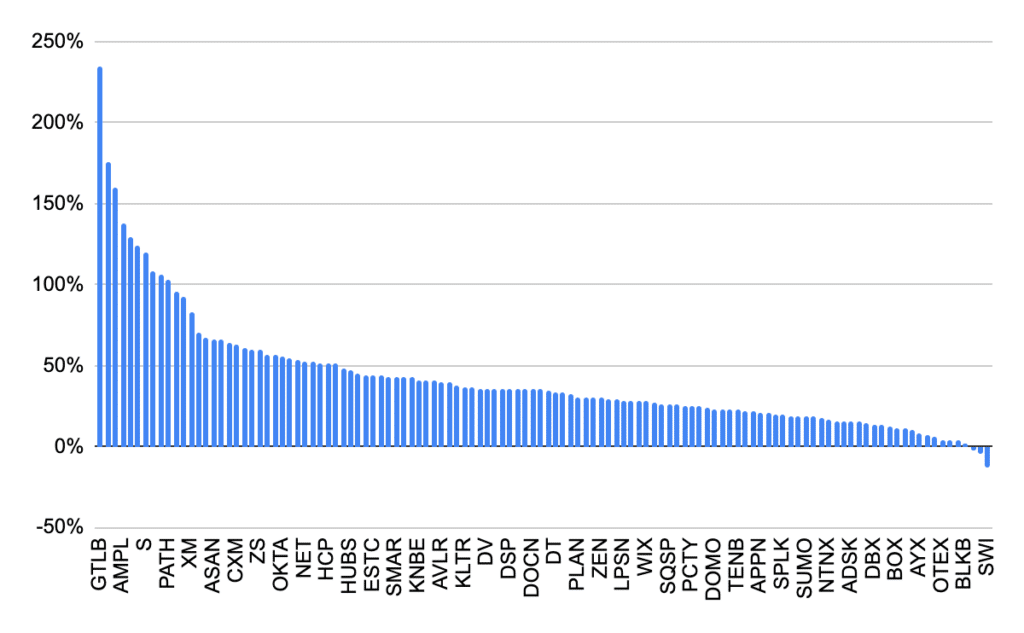
Enterprise SaaS benchmark: Net dollar retention
Here’s the net dollar retention of 120 Nasdaq-listed companies as per the latest quarter (Q1 2022). Most of these numbers look incredibly good: indeed most Enterprise SaaS companies have largely benefited from the pandemic.
As you can see, ~75% of the 120 companies have a net dollar retention above 100%. What’s even more impressive is that a third of them even have a net dollar retention above 120% which is considered excellent. Of course, this likely will not continue and next year’s numbers may look less impressive (to say the least).

4. ARR YoY Growth
This one is easy: it represents the year-over-year growth of ARR.
ARR YoY Growth = ARR (year 2) / ARR (year 1)
Why do we use it?
ARR YoY growth allows us to assess a company’s revenue growth, by taking into account revenue predictability.
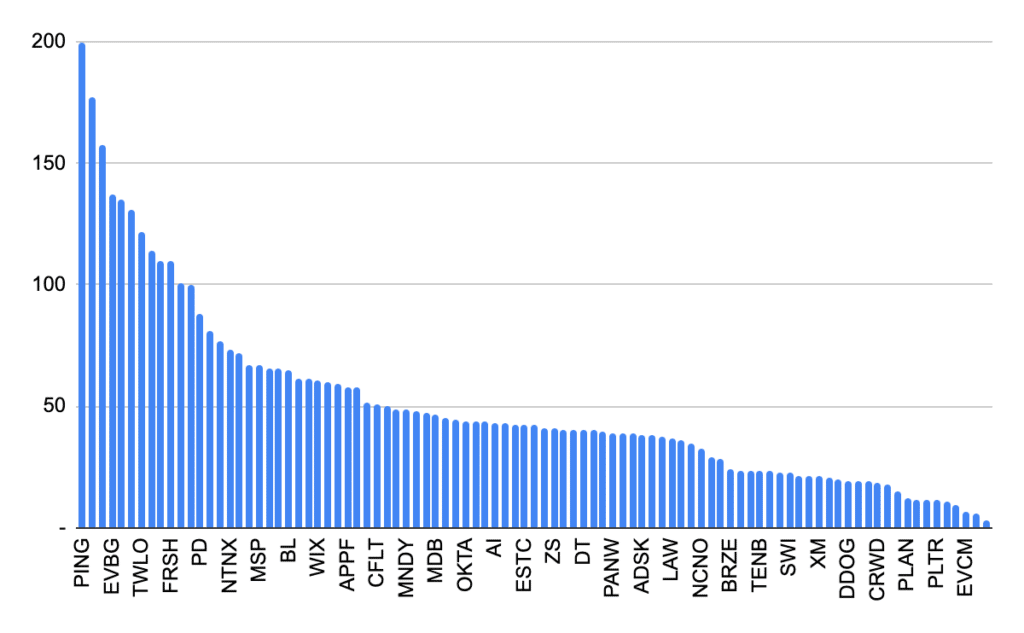
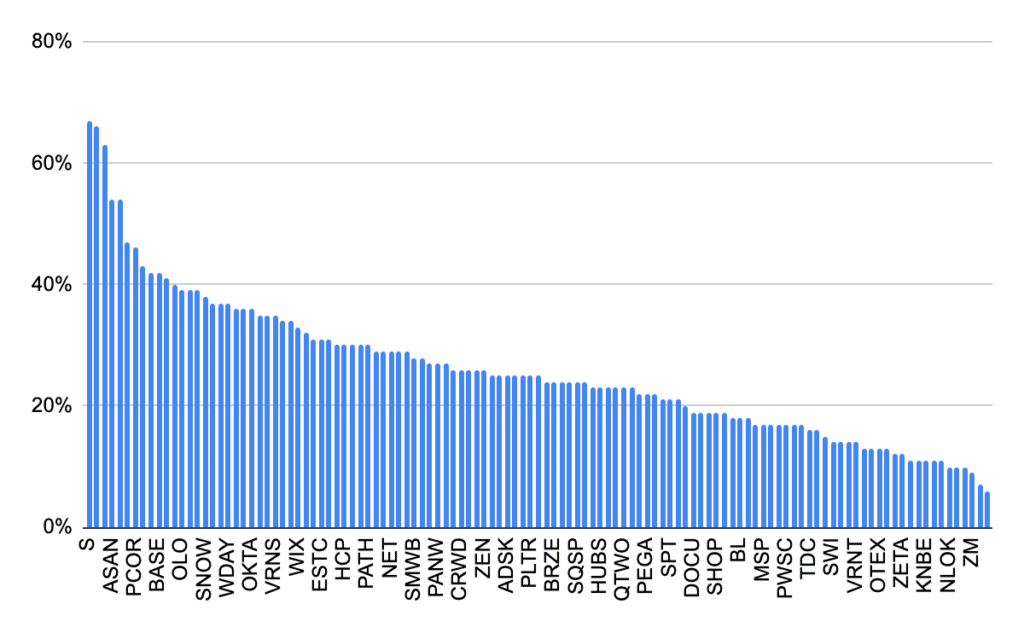
Enterprise SaaS benchmark: ARR YoY growth
The same comment above applies here: 2021 was an exceptional year for most Enterprise SaaS businesses, as evidenced by their ARR YoY growth below.
5. Customer Acquisition Costs (CAC)
Customer Acquisition Costs are by definition all expenses incurred to acquire a customer. For Enterprise SaaS, CaC often is related to either:
- Marketing: paid ads, affiliates, SEO, etc.
- Sales: salary & bonuses of the in-house sales & partnerships team
CAC = Sales & marketing costs / # new customers
Why do we use it?
CAC is one of the various metrics we use to assess the efficiency of a customer acquisition strategy. Yet, CAC alone doesn’t tell us much. Instead, we always compare CAC to LTV (customer lifetime value) or to Gross Profit per Customer (to get CAC Payback, see more below).
Enterprise SaaS benchmark: CAC
Like ARR, CAC vary significantly from one company to another. That makes sense: the more revenue you make per customer, the more you (should) spend to acquire that customer (from competition potentially).
Yet in the chat below we only included 94 companies (and not the 120 set of comparables) as some of them simply do not report the number of new customers they have, which makes it impossible to calculate CAC.
To give you an idea of the magnitude of the differences in CAC between all these companies: whilst WIX spends $18 per customer, Splunk spends over $10 million..!
Yet, this can also be explained by the fact that not all companies reports all their customers. For example Splunk only reports customers with a ARR above $1M, which explains why their CAC is so high.

6. CAC Payback
As explained above, CAC should always be compared vs. another metric. CAC Payback is one of them.
This financial metric represents the number of months it takes a SaaS company to recoup its original customer acquisition cost.
CAC Payback = CAC / Gross Profit per Customer
For example, if you were to spend $100 to acquire one customer, and you earn $10 per month from that same customer (after COGS), it would take you 10 months to pay back your initial investment.
CAC can be calculated in a number of ways. Some use Revenue per Customer instead of Gross Profit per Customer for example.
The problem with revenue is that it doesn’t take into account any expenses at all. In the example above, if ARPA is $50 a month, then payback isn’t 10 months but only 2, which paints a much different picture.
Gross Profit isn’t perfect either as it misses all operating expenses such as salaries, marketing, etc. Yet, unlike EBITDA for example, Gross Profit usually excludes sales & marketing.
In other words, the $10 Gross Profit by Customer above is the actual $10 we have to spend into a variety of things, including sales & marketing.
Why do we use it?
As for CAC, CAC Payback is used to gauge the efficiency and profitability or a customer acquisition strategy. The lower CAC is, the more profitable your sales & marketing strategy is.
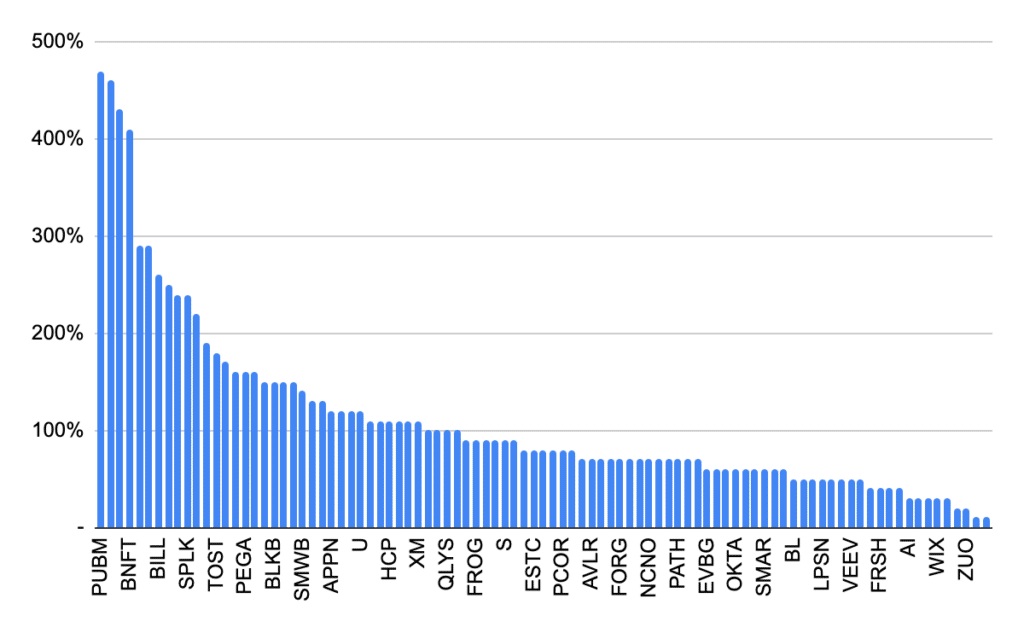
Enterprise SaaS benchmark: CAC Payback
As with CAC, the numbers below should be taken with a grain of salt. For example, companies that only report a certain number of customers (for example above a certain $ARR threshold) tend to have very high CAC: that’s because we divided their Sales & Marketing expenses by the number of customers available in their financial statements.
Excluding outliers (top 10% above 100 months), the average CAC payback is 40 months ie. ~3 years.
7. Magic Number
The Magic Number is another of the various financial metrics we use exclusively for Enterprise SaaS.
This number is obtained by dividing the last period’s (a quarter for example) sales & marketing expenses by the Net New ARR of the current period. Net New ARR is the difference in ARR from one period to another.
Magic Number = Net New ARR (period 2) / Sales & Marketing expenses (period 2)
For example:
| Q1 | Q2 | Q3 | Q4 | |
|---|---|---|---|---|
| ARR | $100 | $105 | $104 | $112 |
| Net New ARR | +$5 | -$1 | +$8 | |
| S&M expenses | $40 | $42 | $44 | $40 |
| Magic Number | 12% | -2% | 20% |
Why do we use it?
Magic number can be very useful to assess how efficient is a company’s customer acquisition strategy. Unlike CAC or CAC payback though, a company’s magic number looks at revenue (ARR) and not the number of customers.
The problem with magic number is that it can vary significantly from one period to another (see table above). As such, it sometimes better to look at a longer period of time (a year instead of quarter for example).
Enterprise SaaS metrics benchmark: Magic Number
Like other metrics in this list, magic number can vary significantly from one company to another.
8. Gross Margin
This is one of the many profitability metrics we use for Enterprise SaaS companies.
Gross margin = Gross profit / Revenue
Why do we use it?
Gross margin gives a pretty good idea of any business’ operating leverage. Operating leverage represents the part of a business’ costs that are fixed costs (as in, they aren’t a function of revenue).
Software companies, like most tech-enabled businesses, typically have high gross margins. That’s because a big part of their costs actually fixed costs (mostly salaries).
Enterprise SaaS benchmark: Gross margin
As explained above, Enterprise SaaS typically have high gross margins (anything above 70% is quite common). Yet, gross margins vary based on the business model but most importantly the way COGS are defined.
For example, some Enterprise SaaS companies include some expenses above gross margins as they are consider them as “variable”. That’s the case of certain salaries (e.g. outsourced customer support is a great example) but also marketing expense (paid ads especially).

9. R&D ratio
Like gross margin, R&D ratio is a profitability ratio. It represents the percentage of revenue a company spend on research & development expenses.
R&D expenses can be anything related to product development and, as such, mostly include certain salaries (the dev team for example).
R&D ratio = R&D expenses / Revenue
Why do we use it?
R&D ratio is used to have an idea of how much the company invests in product development to improve its existing product(s) and/or to launch new product(s).
A high ratio isn’t necessarily bad: on the contrary, a company may choose to spend more in R&D to create new product features that will generate extra revenue for years to come.
Enterprise SaaS benchmark: R&D ratio
Here again, the ratio vary significantly from one company to another. Whilst some companies spend ~10% of their revenue in R&D (Zoom, Toast, etc.), some dedicate over 50%.. (Asana, SentinelOne, etc.)!
10. S&M ratio
Sales & Marketing ratio represents the percentage of revenue a company spends in customer acquisition costs, namely sales & marketing.
As such, S&M ratio is similar to CAC:
- CAC gives a picture of how much a company spends on average to acquire 1 customer
- S&M ratio instead tells us how much of a company’s revenue goes to sales & marketing
S&M ratio = S&M expenses / Revenue
Why do we use it?
We use S&M ratio to have an idea of a company’s distribution strategy.
For example, some companies may choose to have an aggressive distribution strategy and spend a big part of their revenues (sometimes over 100% for startups) in sales & marketing expenses to sell their products.
But most importantly, S&M is often the biggest cost that drives a company’s profitability. In other words, when an Enterprise SaaS business is unprofitable, it’s almost always because of the magnitude of their sales & marketing costs as they opt an aggressive customer acquisition strategy.
The only exceptions to this rule are Seed to Series A startups where product development expenses (R&D) can also be disproportionate vs. other spending categories.
Enterprise SaaS benchmark: S&M ratio
Companies’ S&M spend vary immensely from one software company to another as can seen below. Even publicly-listed companies can spend close to 100% of their revenues on sales & marketing (e.g. Samsara)..!

11. FCF margin
FCF stands for Free Cash Flow. This is one of the most important profitability metrics for Enterprise SaaS companies as it takes into account cash flow.
FCF margin = FCF / Revenue
As a reminder, free cash flow is the amount of cash a company generates in a period (a quarter or a year for example). There are 3 components to free cash flow:
- Operating cash flow: cash from operating activities, in other words the cash flow your business generates (income minus expenses)
- Investing cash flow: cash flow from investing activities that aren’t directly related to your business activities (like the sale proceeds of a building for example, minus any capital expenditures e.g. equipment & other tangible and intangible assets)
- Financing cash flow: cash flow from financing activities (for example any equity investments from investors minus dividends)
Why do we use it?
FCF margin is quite helpful to understand whether a business is generating or losing cash, and in which magnitude.
It’s very important to understand the 3 components of FCF. Indeed, a great business typically generates high operating cash flow (as in the operating activities of the business actually generates positive cash).
Yet, if we look only at FCF, we may find examples whereby a business has a high FCF margin (say 30%) yet a low operating cash flow ratio (say -10%). In that case, the 40% difference may simply be that an investor came in with a big investment, which inflated free cash flow, despite a negative operating cash flow.
Enterprise SaaS benchmark: FCF Margin
FCF ratio usually vary between -50% to +50% for most (mature) Enterprise SaaS businesses.
Yet, FCF ratio benchmarks should be taken with a grain of salt for 2 reasons:
- As explained just now, FCF can be skewed by financing cash flow
- FCF can vary significantly from one quarter to another (mostly due to the financing cash flow swings)
That’s why We’ve included below 2 charts:
- FCF ratio benchmark
- Operating Cash Flow (OpCF) ratio benchmark

12. Rule of 40
The Rule of 40 is a financial metric we use exclusively for SaaS companies.
It’s called the Rule of 40 as investors consider a SaaS business to have a “healthy” growth when its value is equal or above 40.
The Rule of 40 takes into account 2 factors:
- Revenue growth can be LTM YoY growth or ARR growth
- Profitability can either be EBITDA margin, Operating Cash Flow margin or Free Cash Flow margin
Rule of 40 = YoY ARR growth + FCF margin
For example, let’s assume a SaaS business with:
- 30% YoY ARR Growth
- $20M ARR and -$3M FCF: -15% FCF margin
Therefore, its rule of 40 is 30% – 15% = 15%. So this business wouldn’t be considered healthy in regards to the Rule of 40 rule. In comparison, the same business with 30% YoY ARR and $2M FCF would end up with a 40% ratio.
Why do we use it?
The Rule of 40 is one of the most powerful financial metrics for Enterprise SaaS because it takes into account both growth and cash flow profitability.
Indeed, many SaaS companies may compromise cash flow for growth. That doesn’t necessarily mean these companies are by definition loss-making: they are simply investing aggressively in ARR growth.
Enterprise SaaS metrics benchmark: Rule of 40
This is what the 120 publicly-listed Enterprise SaaS companies look like when we compare them based on their Rule of 40 value.
Interestingly enough, only 50% of companies had a Rule of 40 above 40% despite 2021 being a strong year for most SaaS businesses. Outliers include Datadog (112%), Snowflake (111%) and on the lower end HashiCorp (-14%) and ForgeRock (-21%).
