Airbnb / VBRO Rental Financial Model: Complete Guide

Every business needs a financial model. Whether you want to understand what’s your breakeven, your valuation or create a financial model for the business plan of your Airbnb or VRBO rental business (or any other type of short-term rental business), you’ve come the right way.

Airbnb (Property Rental) Financial Model Excel Template
Get a professional business plan and get funding for your business.
1. Forecast Properties
The first step of any Airbnb / VRBO financial model is to forecast the actual number of properties (or “units”) ie. the number of houses and apartments you own and that are available to be leased over time. This means setting a few things:
- How many units you will purchase (or lease) over time, and when
- How much you paid for these units (including design & renovation)
- How you finance the acquisition of these units (leasing or debt and equity)
In order to do so, prepare a table like the one below, where you can list all the different units, their category (houses, apartments, other), their purchase price, and all the criteria listed above.

The different sections are as follows:
- The different types of units and their category (each category will have a different daily rent and occupancy rate as we will see later on)
- For each category, the number of units acquired, the date of acquisition and the purchase price per unit;
- For each category, whether you lease or buy the units:
- If you lease: the term of the lease (how many months will you pay back the lease) and the lease payment per month
- If you buy: the % of the purchase price that’s covered by a loan, the interest rate per year and the term of the loan
That way, you will be able to forecast accurately how many units are available for you to rent:


2. Forecast Occupancy
The second step of our Airbnb financial model is to set the occupancy rate of all your units over time. There are different ways to do this which depend on the level of detail you need.
Maximum occupancy rate
Our recommendation is to set, for each unit, the maximum occupancy rate in high season for a month. For example, you might have 2 properties:
- A 6-persons villa which maximum occupancy rate is 80% in August. Unfortunately, it’s never 100% as you need some time in between each stay to clean the villa, and accommodate guests availabilities (minimum stay of 5 days);
- A 2-persons downtown apartment which maximum occupancy rate is 95% in August. Here, as stays are usually shorter (1-3 days) it’s easier to get closer to 100% occupancy
Seasonality factor
Once you have set the maximum occupancy rate, we will now forecast occupancy rate for the rest of the year. It’s easy: we multiply the maximum occupancy rate (for example 80%) by a monthly seasonality factor that evolves throughout the year:

For example here we have:
- January: 80% x 40% = 32% occupancy rate
- February: 80% x 40% = 32% occupancy rate
- March: 80% x 50% = 40% occupancy rate
- April: 80% x 70% = 56% occupancy rate
- and so on..
This will now allow us to forecast occupancy rate in the future, taking into account seasonality, for all our units.
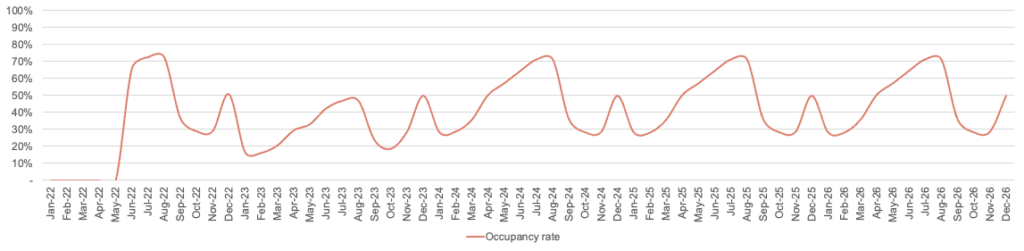
In the example below, you can see the average occupancy rate of all units for the next 5 years, we can see that:
- The first unit is rented in June 2022;
- High season is from June to August (70% occupancy rate)
- There is a rebound around Christmas (around 50%)
Airbnb (Property Rental) Financial Model Excel Template
Get a professional business plan and get funding for your business.
3. Forecast Revenue
Before we dive into how to forecast revenue, it’s important to set a few assumptions for each unit:
- The rental start date (which is usually different than the date of acquisition as you would likely need some time to renovate and/or furnish the place before you can list it on Airbnb)
- The average daily rate (this one can change throughout the year especially during high-season / low-season yet for the sake of simplicity here we’re using the same throughout)
- The maximum occupancy rate discussed above
All these assumptions can be set in a table like the one below. Also, this will allow you to calculate important metrics such as average monthly revenue and yield.

Nights booked
Now that we have estimated both the number of properties (units) available to rent as well as their occupancy rate in the future, we will now calculate the number of nights booked as follows:
Nights booked = Number of days in a month x Occupancy rate
So for example for January 2023 (rounding down to the nearest integer):
Nights booked = 31 days x 32% occupancy rate = 9 nights
Revenue
Revenue is now easily calculated by multiplying the number of nights booked by the daily rate.
For example for January 2023 (assuming it’s a studio at $165 daily rate):
Revenue = 9 night x $165 = $1485
That way we can now obtain revenue for all properties as shown in the chart below:

4. Forecast COGS
For Airbnb rental businesses (or any other type of short-term rental business), Cost of Goods Sold (COGS) are the expenses directly related to the properties you operate and rent. For example, you would typically find the following expenses as COGS for Airbnb businesses:
- Utility bills
- Maintenance (if you need to repair appliances or hire a plumber for instance)
- Insurance
- Property taxes
- Cleaning fees (only if outsourced to a 3rd party company)
- Supplies (free items, toiletries, etc.)
All these expenses can be set per unit (property) as shown in the example below:
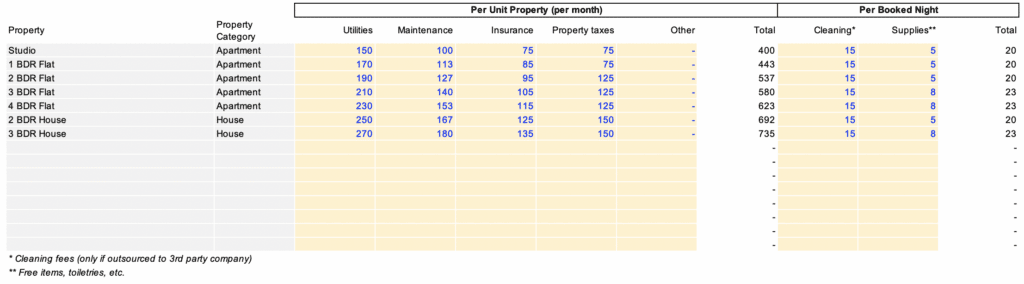
Now you can obtain the breakdown of your COGS by expense category as follows:


5. Calculate Operating Expenses
In addition to COGS, there are a number of expenses which need to be estimated too. A few examples of these operating expenses are:
- Salaries
- Bookkeeping
- Office expenses
- Legal expenses
- Airbnb fee
- Etc.
For salaries, you can use our free hiring plan template (already built in the Airbnb financial model template). For other expenses, you can either set a fixed amount per month or calculate it as a percentage of revenue instead.
Airbnb (Property Rental) Financial Model Excel Template
Get a professional business plan and get funding for your business.
6. Calculate Debt & Interest
Another important part of any Airbnb or similar property rental financial model is to forecast your balance sheet, and more especially:
- Your assets (if you own the properties); and
- The debt (mortgage) used to purchase these properties
Doing so will allow you to do 2 important things:
- Calculate debt interest expenses. Indeed, if you purchase some of the properties with debt, another important expense will be the financial interest on the loan which you must forecast accurately as it will impact your profitability and cash flow
- Forecast your cash flow statement. Indeed, as we will see in the next section, one of the most important impact on your cash flow are debt repayments (not the interest itself but the principal repayments instead)
Therefore, make sure you calculate, each month:
- Any debt drawdown (if you acquire new properties with debt in the future)
- Debt repayment (the actual loan repayments)
Debt issuance, repayments and interest can be forecasted for each property using a loan repayment template. If you don’t know how to do it, we’ve already built it in the Airbnb financial model template.
In the end, you should be able to obtain something like the chart below where you draw down 2 loans for a total of $4,800,000 which you repay over 25 years at a rate of 5.50%:

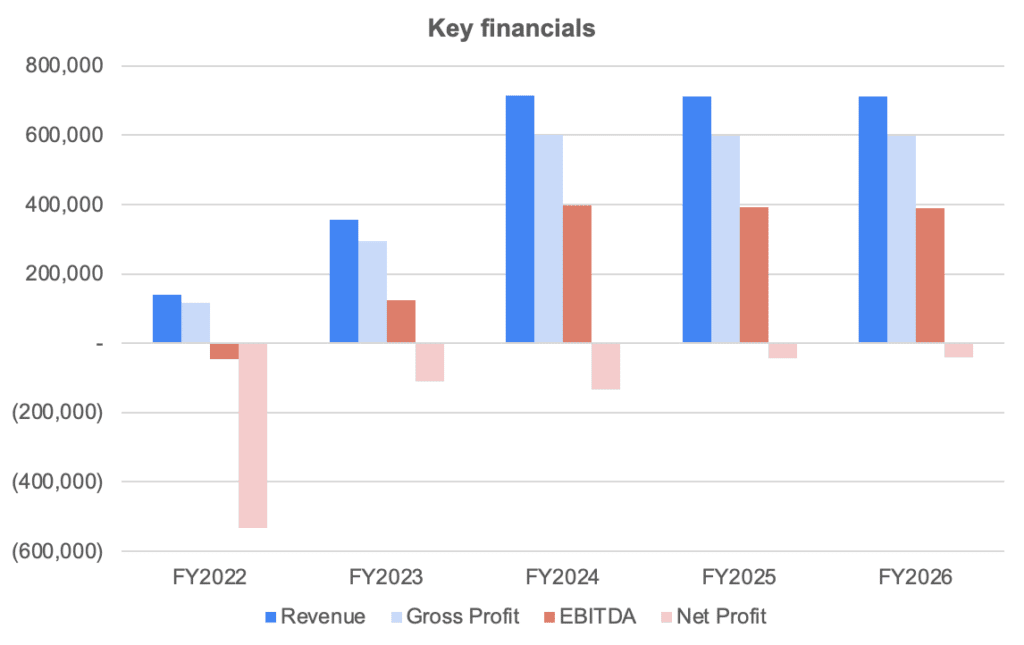
7. Build P&L and Cash Flow
Once we have estimated revenues, expenses and debt, we can easily build the profit-and-loss (P&L) from revenues down to net profit. This will help you to visualise key financial metrics such as Gross Profit or EBITDA margin as shown below:
The cash flow statement, in comparison, needs to include all cash items from the P&L and other cash movements such as capital investments (also referred as “Capex”), fundraising, debt, etc.
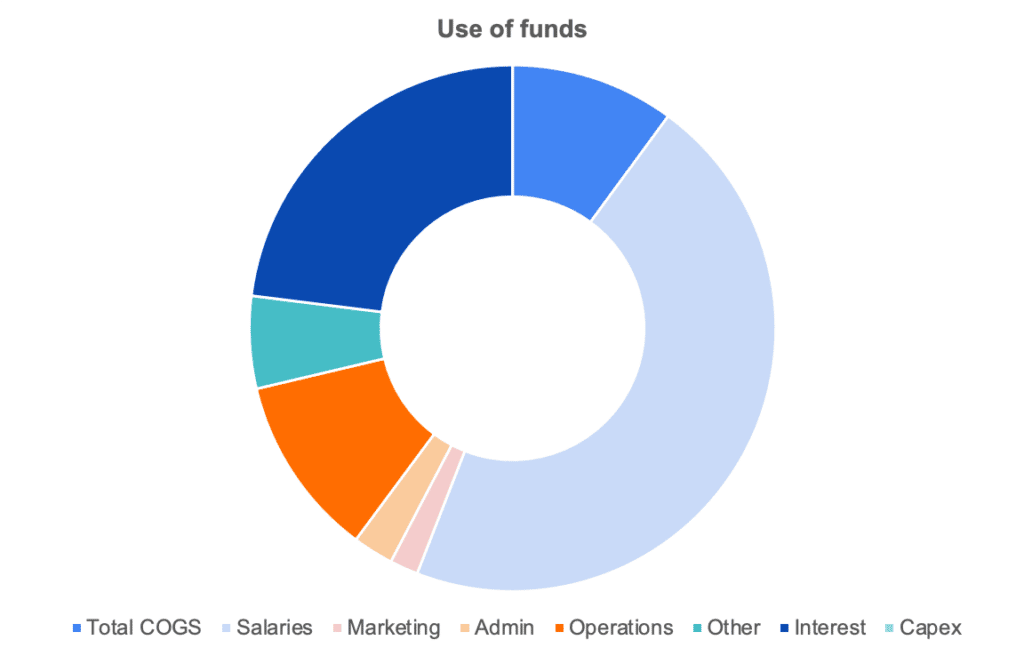
Cash flow is vital as it will help you understand how much funding you should get, either from investors or the bank (SBA loan for example) to start and run your own Airbnb business, which we do in our financial model template with the use of funds chart (see below).
In this chart below, we're showing you the example of a cost structure a Airbnb rental business would incur (excluding the actual cost to purchase the properties)