How to build a SaaS Revenue & Financial Model

Are you building a financial model for a SaaS business? Or are you simply interested in how SaaS revenue model works?
In this article we explain you, step-by-step, how you should build a SaaS revenue model in Excel to calculate MRR, LTV and other SaaS metrics. Let’s dive in!
1. Forecast new users
SaaS revenue is a direct function of the number of users (or “Accounts” for B2B and software companies). Indeed, Monthly Recurring Revenue (MRR) is calculated as:
MRR = Users x Monthly Pricing
So, before forecasting your revenue, you need to calculate the number of users you will ‘acquire’ over time (the “new users”).
You have 2 options to do so:
SaaS financial model: Inbound growth
Users are a function of the number of visitors (to your website for instance) and a conversion rate. This approach is very common for B2C subscription businesses.
Inbound growth
New Users = Visitor traffic x conversion rate
For example, assuming you have a website with 10,000 visitors per month and a 3% conversion rate, you would “convert” 300 new users per month.
New Users = 10,000 x 5% = 300
SaaS financial model: Outbound growth
Here, users are a function of the number of Sales Reps you have and their efficiency (the number of users they convert per month). This approach is used by most B2B subscription startups and, more especially, enterprise SaaS businesses.
Note that with outbound growth we often refer to accounts instead of users. Indeed, accounts are businesses each with a certain number of users.
Outbound growth
New Accounts = Sales Reps x closings per Sales Rep
where
New Users = New Accounts x Users per Account
For example, assuming a Software company with 5 sales people each closing 10 new accounts per month, you would close 50 new accounts per month.
Now, assuming that each account has 30 users, you would convert 1,500 new users per month.
New Accounts = 5 x 10 = 50
New Users = 50 x 30 = 1,500
Read our complete guide on how to forecast inbound and outbound customer acquisition.
2. Split users per tier and billing cycle
Once we have calculated how many new users you onboard (or acquire) over time, we can segment them into the different subscription plans they choose.
Indeed, new customers will choose a plan when converting. Of course, you can assume that most customers choose a free plan (like a free trial) when signing up, and they upgrade later on as we will see in the next section.
Let’s assume you have 4 tiers as follows:
- Free: 40% new users
- Paid: 30%
- Premium: 20%
- Corporate: 10%
This is how would look customer split when they convert:

Note: if you offer different monthly and annual billing cycle prices, you should also set a percentage to break down customers choosing monthly pricing over annual.
3. Forecast active users
Now that we have forecasted new users over time, we need to calculate active users. Before we look at how to calculate it, let’s first explain the different user terms below:
- New users: the number of users you acquire in a given time period (a month for example)
- Net new users: the difference in the number of users from one month to the other
- Active users: the total number of users (who haven’t churned)
In order to calculate active users, we need to forecast users movements between the different subscription plans you offer. In other words, we need to calculate not only churn (users who leave), but those who upgrade and downgrade to different plans as well.
SaaS financial model: Net new users
Net new users is a very important metric that drives active users, and MRR of course.
Net new users is the difference in the number of users from one month to the other (per tier for example). Yet, the difference isn’t necessarily the new users coming in. Instead, the difference must take into account those who left (churn), the new users who just converted (new users) but also upsell and downsell.
Assuming we have 2 subscription plans Basic and Premium, the number of active users for the Premium plan is equal to:
Net New Users (Paid) =
New Users (Premium) + Upsell from (Basic) – Downsell to (Basic) – Churn (Premium)
Where:
- Upsell: customers upselling to a more expensive plan. For example “Basic” users upgrading to the “Paid” plan
- Downsell: same as upsell but the other way around. For example “Paid” customers downgrading to “Basic”
- Churn: customers who cancel their plan and leave
Assuming you build a SaaS financial model with the following numbers in a given month:
| Basic | Premium | |
|---|---|---|
| New users | 10 | 5 |
| Upsell | – | +2 |
| Downsell | +1 | -1 |
| Churn | -5 | -4 |
| Net new users | +6 | +2 |
SaaS financial model: Active users
Now that we have calculated net new users for each subscription tier, we can now obtain the total number of active users per tier as follows:
Active users (month 2) =
Net new users (month 1) + Net new users (month 2)
Using the same example above:
| Basic | Premium | |
|---|---|---|
| New users | 10 | 5 |
| Upsell | – | +2 |
| Downsell | +1 | -1 |
| Churn | -5 | -4 |
| Net new users | +6 | +2 |
| Active users (month 0) | 100 | 50 |
| Active users (month 1) | 106 | 52 |
For example, this is how could look like a SaaS financial model with 4 subscription tiers:

4. Calculate MRR
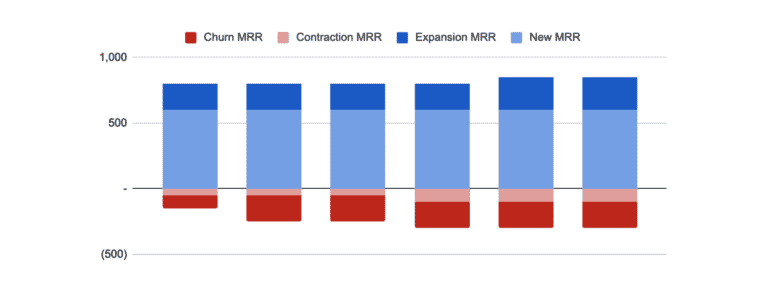
Like for users, we recommend to calculate MRR for each component of revenue: New MRR, Upsell MRR, Downsell MRR and Churn MRR. This allows us to identify where MRR growth comes from (new and upsell), as well as areas of improvements (downsell, churn).
SaaS Financial Model: Net New MRR
Net new MRR is equal to:
Net New MRR =
New MRR + Upsell MRR – Downsell MRR – Churn MRR
Using the same example above, we have:
| Basic | Premium | |
|---|---|---|
| Price (per month) | $10 | $50 |
| New users | 10 | 5 |
| Upsell | – | +2 |
| Downsell | +1 | -1 |
| Churn | -5 | -4 |
| New MRR | $100 | $250 |
| Upsell MRR | – | +$100 |
| Dowsell MRR | +$10 | -$50 |
| Churn MRR | -$50 | -$200 |
| Net New MRR | +$60 | +$100 |
By calculating separately MRR we can now break down MRR and obtain the following chart:

SaaS Financial Model: MRR
MRR is easier to obtain, it’s equal to:
MRR = Active users x Monthly pricing
Using the same example above, we have:
| Basic | Premium | |
|---|---|---|
| Price (per month) | $10 | $50 |
| Net new users | +6 | +2 |
| Net New MRR | +$60 | +$100 |
| Active users | 106 | 52 |
| MRR | $1,060 | $2,600 |
Unlike the MRR breakdown chart above, we can obtain here the MRR breakdown by the different user tiers instead:

5. Forecast Staff
Salaries are often the most important expense category for SaaS businesses. That is why building an accurate and flexible hiring plan is key:
- Accurate because you will need to list all the roles, their salaries and starting dates as accurately as possible in the foreseeable future (12 to 24 months usually)
- Flexible because if it can be cumbersome to list dozens, if not 100’s of roles (especially if you are forecasting 5 years) but also because it may difficult to assess how to scale your workforce in the outer years (anytime beyond 24 months usually)
For example, this is how could look like a hiring plan and salaries for a software company:

For more information around how to build your hiring plan, please refer to our free hiring plan model in Excel format here.
6. Forecast expenses
For expenses other than salaries, list them and try to bundle them into categories. Usual expenses categories for SaaS / subscription businesses include:
1. Cost of Goods Sold (COGS)
- Payment processing expenses
- Hosting (and other tech infrastructure costs)
- Customer service (whether in-house or outsourced)
2. Sales, General & Administrative expenses (SG&A)
- Marketing: paid media, offline marketing, agencies fees, etc.
- Sales: sales commissions
- Other operating expenses: subscriptions, travel costs, office supplies, rent, etc.
- Other expenses: legal advisory, bank fees, miscellaneous, etc.
Note: we recommend adding relevant salaries to their respective expense category (for instance marketing team salaries under Marketing) for more clarity in your forecasts.
When forecasting expenses, you have 2 options, they can be either:
- Dynamically calculated: suitable for variable expenses (they will grow in line with a given metric, such as users, or revenue). It can be as simple as a given % of revenues for instance (payment processing fees), or more complicated (for instance, customer service can be estimated by using the number of customer service tickets, your customer service team efficiency and their hourly rate); or
- An input from you: suitable for fixed expenses (they don’t vary based on growth). They can be expenses such as bank fees, rent, etc.
7. Wrap it up
Once you have built your revenue and your expenses (including all the salaries in the hiring plan), you can easily build your profit-and-loss, cash flow statement and balance sheet. You can also easily calculate key metrics such as cost of acquisition, customer lifetime value, etc.


SaaS Financial Model
Download an expert-built 5-year Excel financial model for your pitch deck
SaaS Financial Model
Download an expert-built 5-year Excel financial model for your pitch deck