How To Build a Financial Model for a Pizzeria?
Whether you want to understand what’s your breakeven, your valuation or create a budget for the business plan of your fast food or pizzeria, you will need to build a solid financial model.
In this article we’ll explain you how to create powerful and accurate financial projections for a casual 1,500 sq. ft. pizzeria. Note that the numbers, charts and financials presented in this article come from our financial model template for pizza shops.
For more information on pizza shops, make sure to check our guides below:
How Much Does It Cost To Open a Pizzeria?
How to Write a Business Plan for a Pizzeria: Complete Guide
1. Forecast Customers
The first thing you must do to create a financial model for your pizzeria or fast food is to forecast the number of customers you will serve over time. You can do it the easy way or make it more complex based on your requirements.
The guidelines below are our recommendations to create accurate and flexible customer projections for any fast food restaurant. To forecast customers, you must set the number of:
- Customers you expect to serve on average on a weekday vs. on a weekend day instead
- Days you are open in a week on average (for example 4 weekdays and 2 weekend days if you are open Tuesday to Sunday)
The second input you can add to your financial projections are the number of restaurants you have. Indeed, this is very useful if you run a number of franchise fast food restaurants for example. If so, simply multiply the number of stores by the number of customers per store as shown below:
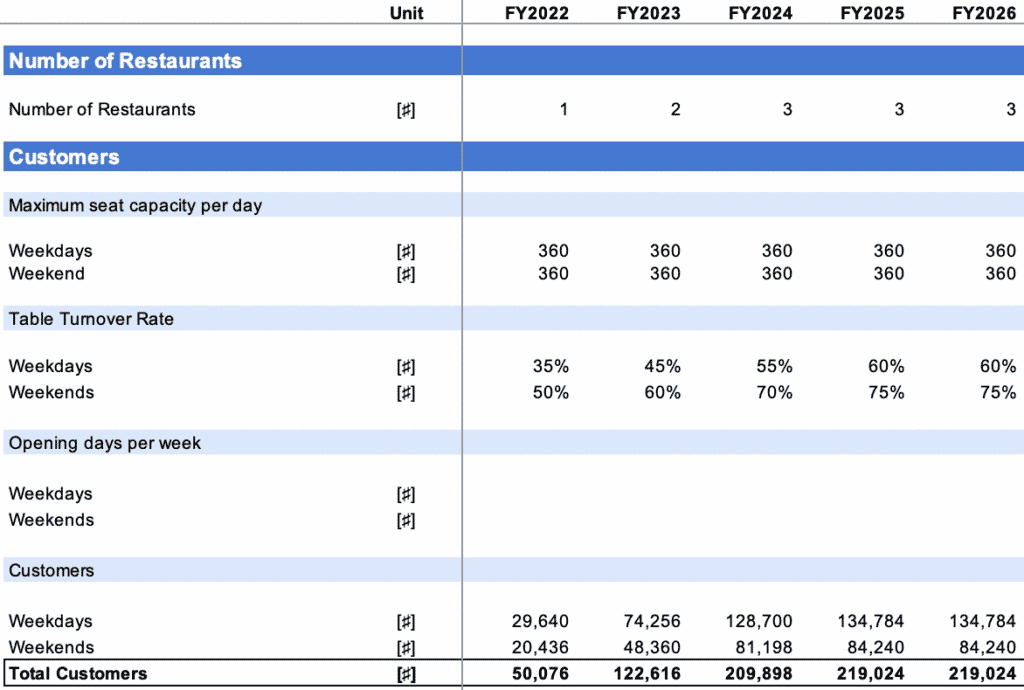
That way, you will be able to forecast accurately the total number of customers you can serve over time, as well as the revenues which we will now see in the next section. Customers can then be represented between those who come on a weekday vs. on weekends as shown in the example below:

2. Forecast Revenue
Now that we have estimated the number of customers over time, the 2nd step of our fast food (or pizzeria) financial model is to calculate revenue.
Yet, before we do so, we must break down the number of customers into the different products they may buy. Indeed, most of you customers may buy a pizza at an average price of $10.50, yet some may also buy other products such as drinks for $5.50, desserts for $4.50 or even a menu for $12.50, etc.
It’s very important to break it down right. Indeed, as you know all these products have very different unit economics (prices and profit margins) you need to forecast accurately. Let’s see now how.
First, break down the products into a percentage of your total customers. For example:
- 30% of the customers may choose to get a pizza at an average price of $10.50;
- another 25% buy a main at an average price of $12.50;
- 20% buy a dessert for $4.50, and so on..
That way, you can now multiply the number of customers for each product by their respective price to obtain revenue.
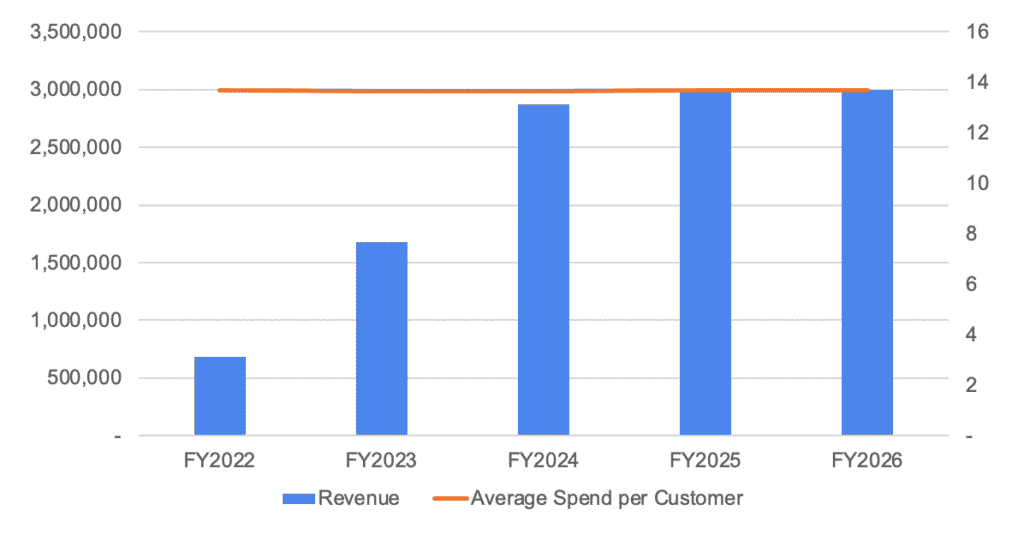
Now you can obtain your revenue projections as well as the average spend per customer as shown below:
3. Forecast Expenses
In addition to the one-off startup costs discussed here, you must also budget for all the operating costs of running a fast food or pizzeria. This is the 3rd step of our fast food (or pizzeria) financial model.
So, we have decided to give you below a clear overview of all the key expenses you can expect for starting a casual 1,500 sq. ft. pizzeria. Note that these costs are for illustrative purposes and depend on a number of factors that may not be relevant to you.
| Operating cost | Amount |
|---|---|
| COGS | $9,000 |
| Rent & utility bills | $4,000 – $5,000 |
| Staff costs | $16,000 – $20,000 |
| Marketing | $2,000 – $4,000 |
| Other (tableware, software, bookkeeping etc.) | $2,000 – $3,000 |
| Total | $33,000 – $41,000 |
COGS
The Cost of Goods Sold (COGS) are the costs you incur to purchase your inventory such as the food supplies that go into the pizza itself e.g. the dough, tomato, ham etc.
The COGS for restaurants is usually between 28% and 35% of monthly revenue, but it can be as high as 40% for high-end restaurants. Of course, the cost will depend on the type of food you serve. Luckily for pizzerias, COGS are more on the lower end (around 25% of sales).
For example, if you sell 100 pizzas on average in a day, this results in 2,500 pizzas a month (assuming 6 days a week). With an average order value of $15 (assuming drinks, etc.), the total monthly revenue would be $37,500. The COGS in that case will be around $9,000.
Staff costs
Staff costs are probably the biggest expense for pizzeria restaurants. Here is a quick list of hourly salaries that you must consider if you’re opening a casual pizzeria:
- Pizza Cooks: Average hourly salary: $14.74
- Restaurant Manager: Average annual salary: $51,180
- Server (only if you offer table service which fast food / casual pizzerias usually don’t): Average hourly salary: $15.72
While table-service restaurants typically spend 30-40% of their revenues in staff expenses.
Assuming the same $37,500 monthly revenue pizzeria example above, this would require around $12,000 – $15,000 in staff costs (4 to 5 full time employees). Adding up a manager’s salary, this would represent $16,000 to $20,000 total per month.
Rent & Utility Bills
If you are leasing a commercial space, you will need to pay monthly rent expenses. Using the same example above, assuming you pay $2.95 sq. ft. per month for a 1,500 commercial space, you’d have to incur $3,750 in rental costs each month.
In addition to the rent itself, you’ll have to pay for utility bills (electricity, gas, water).
Pizzerias and restaurants spend on average $2.90 per sq. ft. per year on electricity and $0.85 per sq. ft. per year on gas costs. Add in the variables of water, internet access, and waste collection, which can all vary substantially from one location to the other.
So assuming a 1,500 sq. ft. pizzeria, you’d spend on average $500 to $750 in utility bills per month.
Marketing
Marketing is a large part of the cost of running a pizzeria, and the amount you pay depends on whether you hire an agency or handle it yourself. There are many alternatives for promoting your pizza business, ranging from more traditional means like television, newspapers, magazines, and radio to more current outlets like social media.
Also, public relations firms can help you expand your advertising channels and manage your social media accounts, but they are also the most expensive alternative.
The Small Business Administration (SBA) recommends spending between 2% and 3% of your revenue on marketing when you’re just starting.
However, if you’re pursuing larger brand awareness campaigns or cooperating with an advertising agency, you can increase your spending to up to 10%-12% of overall sales. Indeed, you’ll logically have to spend more in the first few months as you try to gain new customers. Hopefully with time you will benefit from organic growth (word-of-mouth) and can reduce your marketing spend.
In the end, you'll be able to forecast expenses, either as a fixed value or a percentage of revenues, and obtain a chart of costs by category as shown below.

4. Build your P&L And Cash flow
The final step for our pizzeria financial model is to build the profit-and-loss (P&L) from revenues down to net profit, as well as the cash flow statement.
The profit-and-loss (P&L) is rather simple to build once we have future revenues and expenses. Simply take your revenues and subtract all expenses. The P&L will also help you to visualise key financial metrics such as Gross Profit or EBITDA margin as shown below:

The cash flow statement, in comparison, needs to include all cash items from the P&L and other cash movements such as capital investments (also referred as “Capex”), fundraising, debt, etc.
Cash flow is vital as it will help you understand how much funding you should get, either from investors or the bank (SBA loan for example) to start and run your own fast food.
In this chart below, we're showing you an example of a typical cost structure a 1,500 sq. ft. casual pizzeria would incur. Unsurprisingly, salaries and COGS represent ~70% of total expenses.


