Fazoli’s Franchise Costs $784K – $2.3M (2024 Fees & Profits)
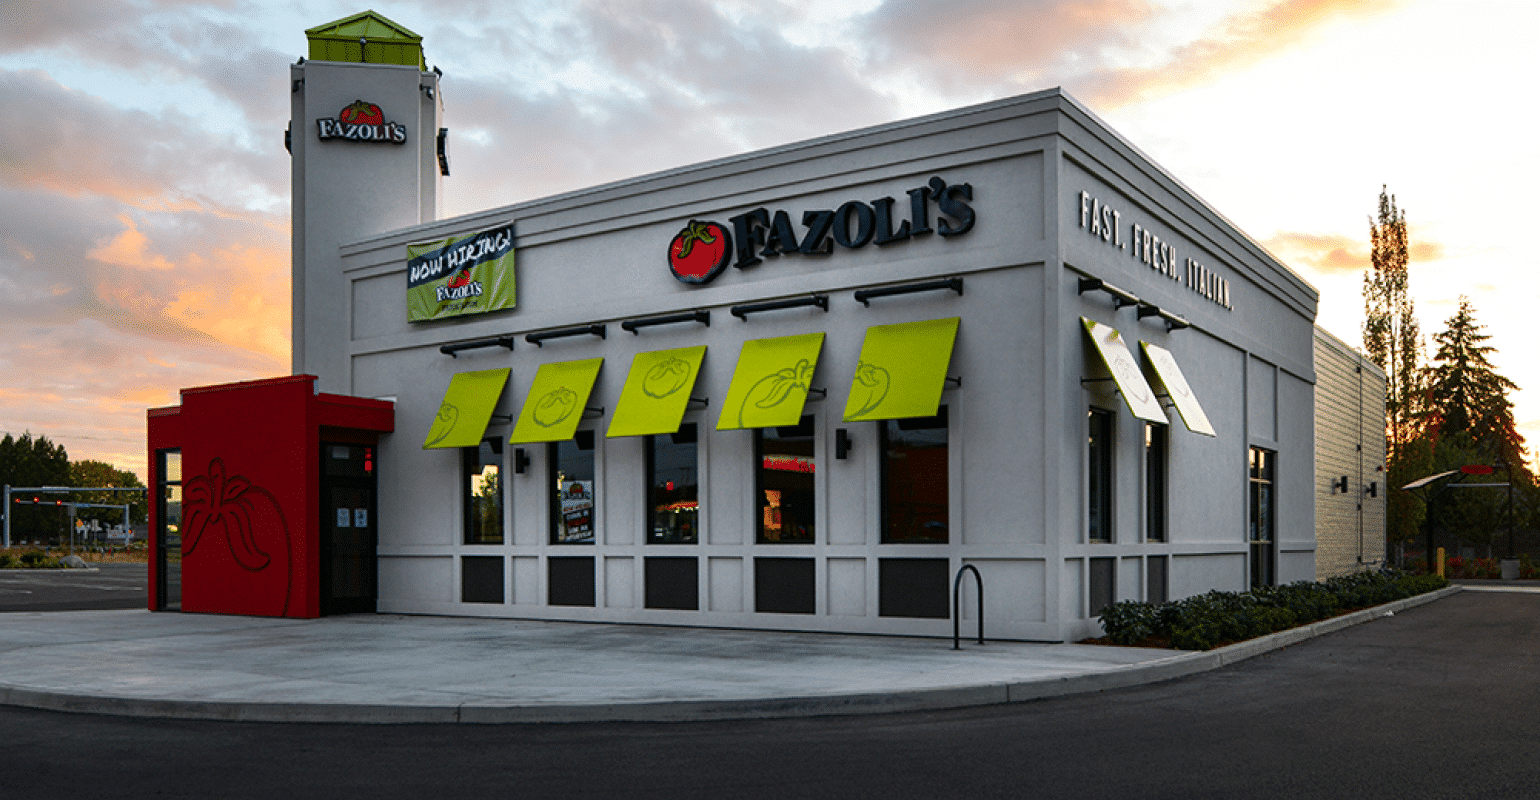
Fazoli’s is a well-established franchise in the quick-service restaurant (QSR) industry, known for offering fast, fresh Italian cuisine in a casual and welcoming atmosphere.
The franchise was founded in 1988 in Lexington, Kentucky, and has since grown into the largest QSR Italian chain in America. Today, Fazoli’s operates over 208 restaurants across 28 states, demonstrating its robust presence and appeal in the competitive foodservice market.
The brand’s menu features a wide variety of Italian dishes, including freshly prepared pasta, sub sandwiches, salads, pizzas, and desserts, with their unlimited signature garlic breadsticks being a standout offering.
What sets Fazoli’s apart from many other QSR brands is its commitment to providing high-quality Italian meals that are made to order, offering a more premium experience while maintaining the convenience and speed that QSR customers expect.


Initial investment
Here’s what you can expect to spend to start a Fazoli’s franchise.
Note: The table above provides a snapshot of the main costs associated with starting the most common franchise format (as disclosed in the Item 7 of the Franchise Disclosure Document). For a complete overview of all the expenses involved with the various formats offered by the franchisor, please consult the Franchise Disclosure Document.

Franchise fees & Royalties
Here are the main ongoing fees the franchisor will ask you to pay going forward to run the franchise.
Initial Franchise Fee
The initial franchise fee for a Fazoli’s franchise is $40,000 for the first restaurant and $35,000 for each additional restaurant.
Royalty Fee
Fazoli’s franchisees are required to pay a royalty fee of 5% of gross sales.
Marketing/Advertising Fee
The marketing/advertising fee is 2% of gross sales, which is allocated to the National Advertising Fund.
Technology Fee
The technology fee is $400 per month, per restaurant.
Transfer Fees
The transfer fee for a Fazoli’s franchise is $7,500.
Renewal Fees
The renewal fee for a Fazoli’s franchise is 50% of the then-current initial franchise fee.
Franchise pros and cons
The Pros:
- Standout Italian dishes: Fazoli’s Italian-American dishes are a breath of fresh air in a fast food industry dominated by chicken, burgers, and tacos. The universally appealing menu has made the fast-casual restaurant an admirable franchising opportunity.
- Explosive growth potential: Fazoli’s offers a lucrative and exciting investment opportunity with its scalable business concept. Its fast-growing nature, paired with the competitive startup costs, gives franchisees limitless growth opportunities in a crowded fast-food industry.
- Zero-down franchise fee: with a zero-down franchise fee for the first investment year, Fazoli’s gives restaurant owners a competitive yet rewarding way to run their businesses. When starting the franchise, franchisees only have to worry about the training and advertising costs.
- Third-party financing: the American fast casual restaurant partners with third-party financers to help the brand owners cover the startup costs, the franchise fee, equipment, and inventory.
- Extensive training: the brand provides extensive training, including 90-100 hours of on-the-job training and 16 hours of classroom training to equip franchisees with everything they need to operate a modern, successful, and competitive franchise. Franchisees learn everything about the business, from staff management to customer service, products, and operations.
- Exclusive territories: the fast-casual restaurant offers a fixed area for franchisees to start and operate their businesses. The franchisor doesn’t allow competing units to operate within the same territory. This gives franchisees massive room for growth by constantly exploring the market for better opportunities.
The Cons:
- Prefers candidates with background experience: an ideal franchisee must demonstrate solid experience running a similar unit. This might put off novice investors.
- No absentee ownership: Fazoli’s franchise isn’t a passive investment. Restaurant owners must be involved in everyday operations.
- No part-time ownership: the franchise agreement dictates that Fazoli’s franchise is a full-time, long-term investment opportunity.
- It can’t be run from home or as a mobile unit: restaurant owners must run the franchise from physical locations.
- Competition from pizza chains (Marco’s Pizza, Pizza Ranch, Blaze Pizza, Hungry Howie’s, Mountain Mike’s, etc.)
Download the Franchise Disclosure Document
How to open
Opening a Fazoli’s franchise involves several steps, designed to ensure you are a good fit for the franchise. Here are the main steps to follow to open a Fazoli’s franchise.
1. Research the Franchise Opportunity
- Evaluate the Market: Assess the demand for a Fazoli’s franchise in your area. Consider competition, customer demographics, and location potential.
- Review the Franchise Disclosure Document (FDD): This document provides crucial details, including costs, fees, and obligations. Ensure you fully understand the terms.
2. Meet the Financial Requirements
- Initial Investment: Prepare for an initial investment, which typically ranges from $850,200 to $1,399,818 depending on location and size.
- Net Worth and Liquid Capital: Ensure you meet Fazoli’s financial requirements, including a minimum net worth and liquid capital. Specific amounts will be detailed in the FDD.
3. Submit a Franchise Application
- Complete the Application: Fill out Fazoli’s franchise application form with accurate and detailed information about your financial status, business experience, and desired location.
- Interview Process: After submitting your application, you may be invited for an interview to discuss your qualifications and alignment with the brand.
4. Secure a Location and Sign the Franchise Agreement
- Location Approval: Work with Fazoli’s team to find and secure an optimal location that meets their criteria.
- Franchise Agreement: Once a location is approved, sign the franchise agreement, which legally binds you to the terms of operating a Fazoli’s franchise.
5. Complete Training and Begin Operations
- Training Program: Attend Fazoli’s comprehensive training program covering operations, marketing, and management.
- Grand Opening: Once training is complete and the restaurant is set up, plan and execute your grand opening with support from Fazoli’s corporate team.
Disclaimer
Disclaimer: This content has been made for informational and educational purposes only. We do not make any representation or warranties with respect to the accuracy, applicability, fitness, or completeness of the information presented in the article. You should not construe any such information or other material as legal, tax, investment, financial, or other professional advice. Nothing contained in this article constitutes a solicitation, recommendation, endorsement, advertisement, or offer to buy or sell any franchises, securities, or other financial instruments in this or in any other jurisdiction in which such solicitation or offer would be unlawful under the franchise and/or securities laws of such jurisdiction.
All content in this article is information of a general nature and does not address the detailed circumstances of any particular individual or entity. Nothing in the article constitutes professional and/or financial and/or legal advice, nor does any information in the article constitute a comprehensive or complete statement of the matters discussed or the law relating thereto. You alone assume the sole responsibility of evaluating the merits and risks associated with the use of any information or other content in this article before making any decisions based on such information or other content.