How To Build a Financial Model For a Dark Kitchen
Every business needs a financial model. Whether you want to understand what’s your breakeven, your valuation or create a financial model for the business plan for your dark kitchen, you’ve come the right way.
In this article we’ll explain you how to create a powerful and accurate financial model for a standard dark kitchen with $120k in average monthly revenue.
For more information on dark (or "cloud", "ghost") kitchen businesses, make sure to check our guides below:
How to Start a Ghost Kitchen in 11 Steps: Complete Guide
How Much Does It Cost To Open a Dark Kitchen?
Business Plan Template For a Ghost Kitchen: Complete Guide
1. Forecast the Number of Orders
The first thing you must do to create a financial model for your dark kitchen is to forecast the number of orders you receive and prepare over time. You can do it the easy way or make it more complex based on your requirements.
The guidelines below are our recommendations to create accurate and flexible projections for any dark kitchen:
Forecasting orders can be done as follows. You must set the number of:
- Orders you expect to receive on average per hour (breakfast, lunch and dinner)
- The number of opening hours for breakfast, lunch and dinner (say, 0 for breakfast, 5 for lunch, and 6 hours for dinner)
- Days you are open in a week on average (for example 4 weekdays and 2 weekend days if you are open Tuesday to Sunday)
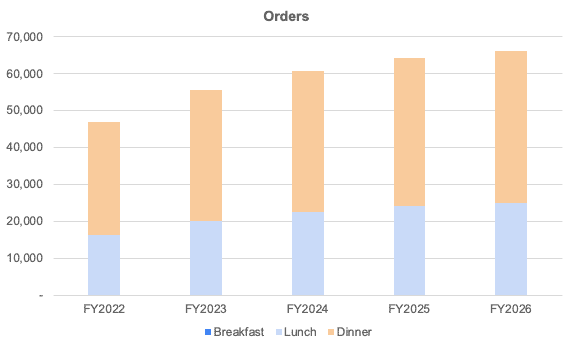
Tip: the values you enter can be set over time, for example for each year as shown in the example below.
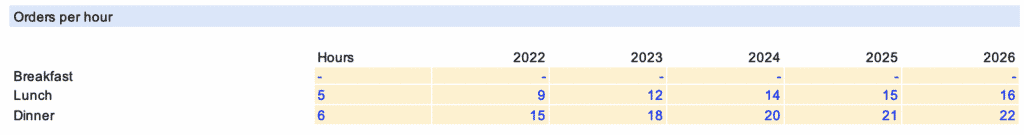
That way, you will be able to forecast accurately the number of orders you can prepare over time, as well as the revenues which we will now see in the next section.
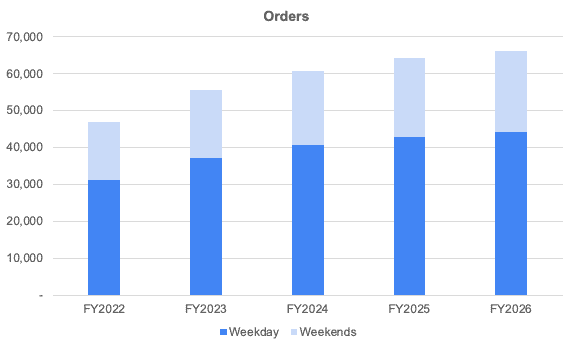
Orders can be represented under different formats: either between weekday and weekends or between breakfast, lunch and dinner as shown in the examples below.
2. Calculate Revenue
Now that we have estimated the number of orders over time, we can calculate revenue. For ghost kitchen, there are 2 components to revenue:
- Revenue from the sale of orders
- Delivery fee (only if you operate your own fleet of delivery drivers)
a) Revenue from the sale of orders
Yet, before we do so, we must break down the number of orders into the different products they may buy. Indeed, most of you customers may buy a main at an average price of $20.00, yet some may also buy other products such as starter for $12.00, desserts for $7.00 or even alcoholic drinks for $6.50 on average.
It’s very important to break it down right. Indeed, as you know all these products have very different unit economics (prices and profit margins) you need to forecast accurately. Let’s see now how.
First, break down the products into a percentage of your total customers. For example:
- 30% of the customers may choose to get a starter at an average price of $12.00;
- another 60% buy a main at an average price of $20.00;
- 15% buy a dessert for $6.50, and so on..
That way, you can now multiply the number of orders for each product by their respective price to obtain revenue for your dark kitchen.
b) Delivery fee
In addition to revenue from the sale of orders to your customers, if you decide to operate your own delivery logistics (for example you have a few drivers working for you) instead of relying on third party food delivery apps (e.g. UberEats, Grubhub, etc.), you will need to add a delivery fee for each order (for example $4.50 per order).
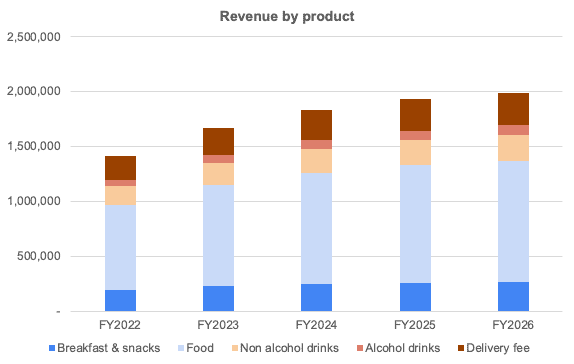
Now you can obtain your revenue projections broken down by the type of product categories as shown below. Instead of using separate menu items, we recommend to group them under categories instead (e.g. food, drinks, etc.).
3. Forecast Expenses
The third step of your dark kitchen financial model is to forecast expenses.
In addition to the startup costs discussed here, there are a number of recurring (or “operating”) costs that any dark kitchen must budget for. Below we have laid out 2 examples of cloud kitchens and their respective operating cost estimates:
- A kitchen you own (whether you rent or bought the space);
- A shared kitchen
Note that these costs are purely for illustrative purposes and may not fully apply to your business.
For more information on how much it costs to run a ghost kitchen vs. a restaurant, read our complete guide here.
| Operating cost | Own kitchen | Shared kitchen |
|---|---|---|
| COGS | $14,000 – $17,500 | $14,000 – $17,500 |
| Food delivery apps commission | $10,000 – $15,000 | $10,000 – $15,000 |
| Rent (or mortgage payments) | $2,000 (rent) | $0 |
| Rent (shared kitchen) | $0 | $6,250 – $10,000 |
| Staff costs | $10,000 – $12,500 | $10,000 – $12,500 |
| Other (POS, bookkeeping, insurance, marketing etc.) | $1,500 – $3,500 | $1,500 – $3,500 |
| Total | $37,500 – $50,500 | $41,500 – $58,500 |

Ghost Kitchen Financial Model Template | Excel Spreadsheet
Download an expert-built 5-year Excel financial model for your business plan
Ghost Kitchen Financial Model Template | Excel Spreadsheet
Download an expert-built 5-year Excel financial model for your business plan
COGS
Like any other restaurant, the Cost of Goods Sold (COGS) is perhaps the most important operating cost you must account for when operating a dark kitchen.
The COGS for restaurants is usually between 28% and 35% of monthly revenue, but it can be as high as 40%. Of course, the cost will depend on the type of food you serve. For instance, a steakhouse will usually have a COGS of 40%, while an Italian restaurant will have COGS of 28%.
For example, if you receive 100 orders in a day, that’s 2,500 orders a month (assuming 6 days a week). With an average order value of $20, the total monthly revenue would be $50,000. The COGS in that case will be around $14,000 – $17,500.
Do not forget that this percentage can significantly fluctuate depending on factors like local & international supply and demand, international trade restrictions, supplier contract terms, and more.
Food delivery apps commission
If you decide to rely only on food delivery apps (UberEats, Grubhub, etc.), you will have to pay (costly) commission fees for each order.
Unless you are a very successful, established restaurant or ghost kitchen (or a franchise), it’s likely that you will fall into the most standard commission fee of 30%.
So assuming monthly revenue is $50,000, that’s an additional $15,000 in costs for delivery commissions alone. This assumes 100% of your orders come from food delivery apps.
Keep in mind that having your own courier may save you money, yet it will also be more complicated to run logistics and less flexible.

Rent (or Mortgage Payment)
If you leased a restaurant space, you will need to pay monthly rent. On the other hand, if you took a loan to buy the restaurant space, there will be monthly mortgage repayment. However, the amount you pay per month will depend on a number of factors including the size of the space, location, lease or purchase, and more.
Using the same example as before, assuming you rent a 1,000 commercial space for your kitchen (at $25 per sq. ft. per year), you would be paying $2,000 per month in rent.
Rent (shared kitchen)
Now, assuming you rent a fully functional shared kitchen, you would be paying a rent like you would for an empty commercial space.
The cost will, logically, be much higher though. Indeed, here you’re saving on the cost to purchase all the necessary kitchen equipment discussed earlier.
The cost is usually quoted per day (or per month) and varies based on the amenities (cold room or not, storage unit, office, etc.), the location and other factors. As a rule of thumb, you would be paying around $250 to $400 for a large (1,000 sq. ft.) kitchen in a prime location in the US. That’s a total of $6,250 to $10,000 per month (assuming you rent 25 days a month).
Employee Salaries
COGS and employee salaries are the most important costs to operate a restaurant. This cost is also a variable cost and depends on the location and various other factors.
For example, a head chef earns on average $50,500 per year in the US. Prep cooks instead earn
As a percentage of sales, dark kitchen spend much less vs. restaurants. This makes sense as there is no serving (no waiters and waitresses, no hosts). That’s why ghost kitchens typically attain staff costs as low as 20-25% of sales, close to fast food restaurants with counter-service only, and far from table-service restaurants that typically spend 30-40% of their revenues in staff expenses instead.
So assuming the same $50,000 monthly revenue, this means you would spend around $10,000 – $12,500 in staff costs per month (4 employees).

4. Build your Dark Kitchen P&L and Cash Flow
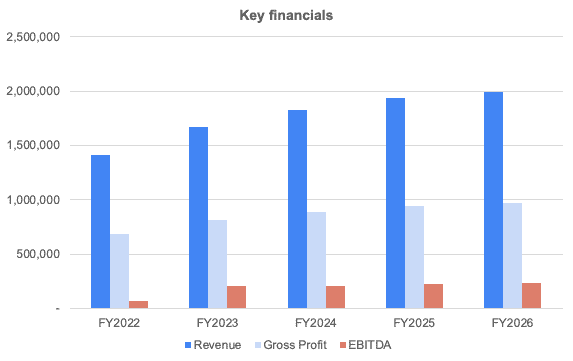
Once we have forecasted revenues and expenses, we can easily build the profit-and-loss (P&L) from revenues down to net profit. This will help you to visualise key financial metrics such as Gross Profit or EBITDA margin as shown below:
The cash flow statement, in comparison, needs to include all cash items from the P&L and other cash movements such as capital investments (also referred as “Capex”), fundraising, debt, etc.
A cash flow statement is a vital part of your financial model as it will help you understand how much funding you should get, either from investors or the bank (SBA loan for example), to open and run your own dark kitchen.
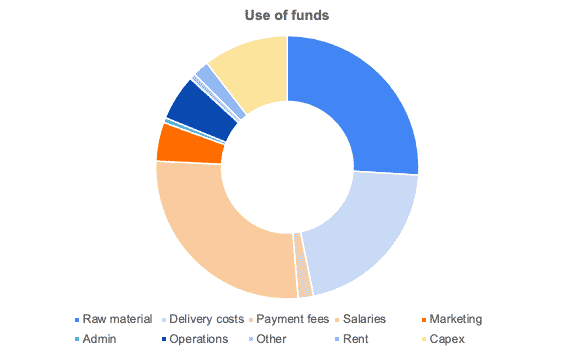
In this chart below, we're showing you an example of a typical cost structure a standard cloud kitchen business would incur. Unsurprisingly, salaries, delivery fees and COGS represent ~75% of total expenses. Restaurants, in comparison, spend significantly more in salaries and rent as they have a sit-in area and need to hire waiters, waitresses and hosts.
Ghost Kitchen Financial Model Template | Excel Spreadsheet
Download an expert-built 5-year Excel financial model for your business plan
Ghost Kitchen Financial Model Template | Excel Spreadsheet
Download an expert-built 5-year Excel financial model for your business plan