
500+ business plans
and financial models


Capriotti’s Sandwich Shop, founded in 1976 in Wilmington, Delaware, has grown from a family-run shop to a nationally recognized franchise known for its high-quality sandwiches.
Headquartered in Las Vegas, Nevada, Capriotti’s differentiates itself with its dedication to fresh ingredients, such as slow-roasted Butterball turkeys and American Wagyu beef, ensuring a fanatically delicious experience.
The franchise offers robust support in various operational aspects, from site selection to marketing, and emphasizes a unique company culture led by owners who began as franchisees themselves.
Number of locations
Here’s how many Capriotti’s there are in the US today.
| TOTAL UNITS 141 |
| FRANCHISED UNITS 128 |
Find the most profitable franchises on

Compare 1,000+ franchises and download unlimited FDDs
 | Capriotti’s |
| FRANCHISE FEE | $40,000 |
| ROYALTY FEE | 6% to 7% |
| INITIAL INVESTMENT | $109,000 – $749,000 |
| AVERAGE REVENUE | $948,000 |
Initial investment
Here’s what you can expect to spend to start a Capriotti’s franchise.
| Type of Expenditure | Amount (Traditional Restaurant) |
|---|---|
| Franchise Fee | $40,000 |
| Development Services Fee | $10,000 |
| Architectural/Engineering Fees and Project Management | $15,000 – $32,500 |
| Professional Services | $2,000 – $8,000 |
| Permits and Licensing | $3,000 – $17,000 |
| Rent | See Note 7 |
| Security Deposits | $3,100 – $15,000 |
| Leasehold Improvements | $142,000 – $290,000 |
| Furniture, Fixtures, Equipment, and Smallwares | $100,000 – $175,000 |
| Interior Décor | $4,000 – $13,000 |
| Exterior Signage | $5,000 – $21,000 |
| Menu Boards | $800 – $2,000 |
| POS System | $6,200 – $20,000 |
| Training | $15,000 |
| Opening Inventory | $7,000 – $15,000 |
| Shop Launch Marketing Plan | $30,000 |
| Pre-Opening Mock Operations | $3,000 |
| Insurance (3 Months) | $1,000 – $2,000 |
| Additional Funds – 3 Months | $30,000 – $40,000 |
| Total (excluding real estate purchase and lease costs) | $417,000 – $749,000 |
Note: The table above provides a snapshot of the main costs associated with starting the most common franchise format (as disclosed in the Item 7 of the Franchise Disclosure Document). For a complete overview of all the expenses involved with the various formats offered by the franchisor, please consult the Franchise Disclosure Document.
Franchise fees & Royalties
Here are the main ongoing fees the franchisor will ask you to pay going forward to run the franchise.
Initial Franchise Fee
The initial franchise fee for Capriotti’s, as detailed in the Franchise Agreement where no development rights are granted, is a lump sum payment of $40,000. This fee is payable in full when you sign the Franchise Agreement and is fully earned when paid, being non-refundable in consideration of administrative and other expenses incurred in granting the franchise and for lost or deferred opportunity to franchise others .
Royalty Fee
Franchisees are required to pay a royalty fee amounting to 6% to 7% of the monthly gross sales. This fee contributes to the ongoing support and resources provided by the franchise system.
Marketing Fund
A contribution of up to 4% of monthly gross sales is allocated to the marketing fund, which supports brand-wide advertising and promotional efforts.
Technology Fee
The technology fee, which supports the use of the franchise’s technology and systems, is currently set at 2% of monthly gross sales.
Cooperative Advertising
A mandatory contribution of 2% of monthly gross sales is directed towards cooperative advertising efforts to bolster regional or national marketing campaigns.
Transfer Fee
In the event of a franchise transfer, the fee is the greater of $10,000 or 5% of the sales price, with a cap at $20,000, facilitating the smooth transition of ownership.
Renewal Fee
For franchisees wishing to renew their franchise agreement, a renewal fee of $10,000 is applicable, ensuring the continuation of the franchise partnership.
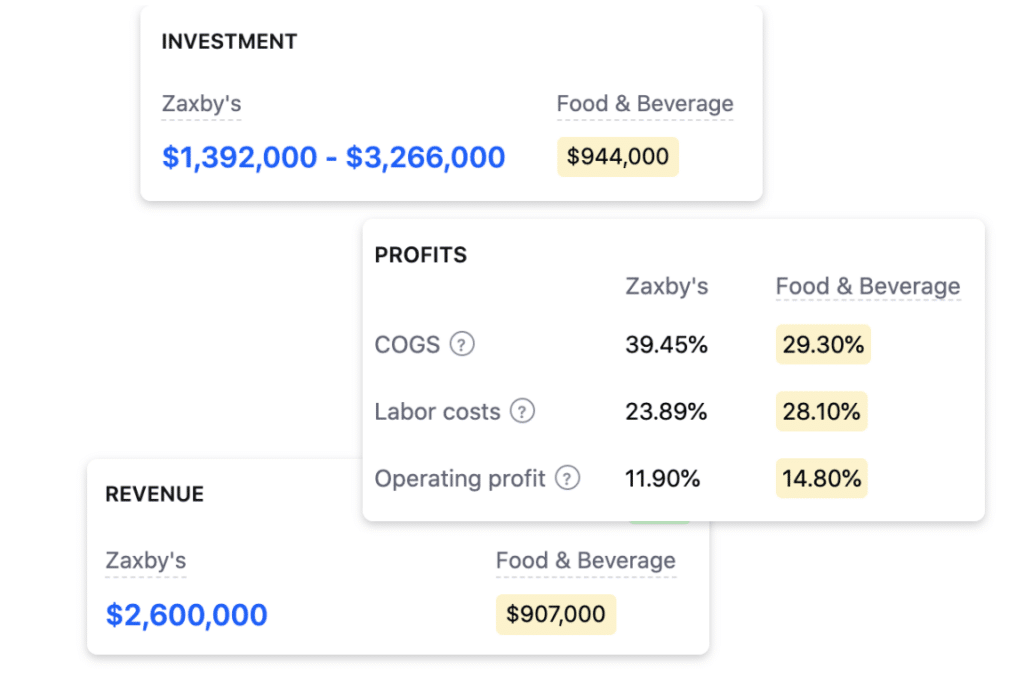
Revenue & Profits
Here’s how much revenue and profits you can make with a Capriotti’s franchise.
Find the most profitable franchises on
Compare 1,000+ franchises and download unlimited FDDs
| Capriotti’s |
| FRANCHISE FEE | $40,000 |
| ROYALTY FEE | 6% to 7% |
| INITIAL INVESTMENT | $109,000 – $749,000 |
| AVERAGE REVENUE | $948,000 |
Franchise Pros and cons
The Pros:
- Innovation and technology: The brand embraces technology and innovative products and delivery methods to help franchises be efficient and boost sales. Franchisees benefit from innovative store design, pick-up, catering orders, and integration with mobile and online ordering. Also, the brand keeps exploring new technological trends to drive demand and stand out from the competition.
- Strong vendor network: Capriotti’s has a strong vendor relationship. It provides franchisees with consistent, high-quality food supplies, equipment, and inventory. Also, franchisees can leverage the brand’s purchasing power and get supplies at relatively low prices to increase their profitability.
- Marketing support: The brand has a strong, integrated marketing strategy to help franchisees create great product awareness. Franchisees can use national media, local store marketing strategies, targeted promotional campaigns, and social media advertising to achieve wide geographical coverage in their locations.
- Exclusive territory: The franchisor allows its franchisees a protected development market to operate their restaurants. It does not authorize any other franchise or operate a rival business in the area.
- Simplified operations: Capriotti’s has a simple and easy-to-follow proprietary system to cater to experienced and new franchisees in the sandwich industry. Franchisees are assured of a business model to create efficient and quality service for their customers.
- Quality pre-opening training: The brand has a simplified and detailed training program for franchisees to learn everything about its concept, from making its sandwiches to serving customers well and running a successful restaurant. It provides its franchisees with online and in-person training on retail sales, operations, and growth strategies at every stage of the restaurant’s growth.
- Ongoing support: The brand provides its franchisees with ongoing support and consultations to ensure they run their businesses smoothly. Franchisees get timely communications about new or existing product improvements, new procedural changes, and performance reviews.
The Cons:
- No financing: The brand does not directly or indirectly finance its franchisees. Also, it does not guarantee the leases, notes, or grants of its franchisees.
- Not a passive investment: The franchise does not offer an absentee ownership business opportunity. Franchisees are supposed to be actively involved in the restaurant’s daily operations.
- Not a part-time business: The franchisor requires franchisees to be open all the time as per the brand’s working hours.
- Strong competition from other Italian food franchises (and pizza franchises) like Rosati’s, Fazoli’s, Marco’s Pizza, Pizza Ranch, Blaze Pizza, Hungry Howie’s, Mountain Mike’s, just to name a few.
How to open a Capriotti’s franchise
Opening a Capriotti’s franchise involves several steps, designed to ensure you are a good fit for the franchise. Here are the main steps to follow to open a Capriotti’s franchise.
1. Conduct Preliminary Research
- Understand the Brand: Learn about Capriotti’s history, mission, and values to ensure they align with your own.
- Market Analysis: Research the market to identify potential locations where a Capriotti’s franchise could thrive, considering local competition and demand.
- Financial Requirements: Review Capriotti’s financial requirements for franchisees, including initial investment, franchise fees, and ongoing royalties.
2. Submit an Inquiry
- Initial Contact: Reach out to Capriotti’s through their official website or franchise inquiry channels to express your interest.
- Provide Information: You may need to provide personal and financial information to demonstrate your capability to run a franchise.
3. Attend Discovery Day
- Introduction: Attend a discovery day or webinar hosted by Capriotti’s to get an in-depth understanding of the business model, support systems, and expectations.
- Q&A Session: Use this opportunity to ask questions and interact with key Capriotti’s personnel.
4. Review Franchise Disclosure Document (FDD)
- Obtain FDD: Receive and thoroughly review the Franchise Disclosure Document, which outlines all critical aspects of the franchise, including fees, obligations, and performance expectations.
- Legal Consultation: Consider consulting with a franchise attorney to understand the legal aspects and commitments.
5. Secure Financing
- Budget Planning: Based on the information in the FDD, plan your budget, considering all costs, including the initial investment, working capital, and any unforeseen expenses.
- Funding Options: Explore financing options, which could include loans, partnerships, or personal savings, to meet the financial requirements.
6. Sign Franchise Agreement
- Finalize Terms: Negotiate and finalize the terms of the franchise agreement with Capriotti’s.
- Sign Agreement: Once comfortable with the terms, sign the franchise agreement to officially become a Capriotti’s franchisee.
7. Secure a Location
- Site Approval: Work with Capriotti’s to identify and secure a suitable location for your franchise, meeting the brand’s criteria for size, location, and demographics.
- Lease Negotiation: Negotiate the lease terms for the property, ideally with the assistance of a real estate professional familiar with commercial leases.
8. Training and Development
- Comprehensive Training: Participate in Capriotti’s training program, covering everything from operations, customer service, to local marketing strategies.
- Staff Hiring: Recruit and train your staff according to Capriotti’s guidelines to ensure consistent service and product quality.
Disclaimer
Disclaimer: This content has been made for informational and educational purposes only. We do not make any representation or warranties with respect to the accuracy, applicability, fitness, or completeness of the information presented in the article. You should not construe any such information or other material as legal, tax, investment, financial, or other professional advice. Nothing contained in this article constitutes a solicitation, recommendation, endorsement, advertisement, or offer to buy or sell any franchises, securities, or other financial instruments in this or in any other jurisdiction in which such solicitation or offer would be unlawful under the franchise and/or securities laws of such jurisdiction.
All content in this article is information of a general nature and does not address the detailed circumstances of any particular individual or entity. Nothing in the article constitutes professional and/or financial and/or legal advice, nor does any information in the article constitute a comprehensive or complete statement of the matters discussed or the law relating thereto. You alone assume the sole responsibility of evaluating the merits and risks associated with the use of any information or other content in this article before making any decisions based on such information or other content.
Interested in buying a Capriotti’s franchise?
Download the financial plan built with the latest Franchise Document.